The FTA diagram sample "Fault tree analysis - Insulin delivery system" was redesigned from the illustration of "CMSI 641: Introduction to Software Engineering. Design of Critical Systems. B.J. Johnson. 2005. Loyola Marymount University".
"Another way of assessing hazards is using fault tree analysis. In this process, each of the identified hazards is covered by a detailed analysis to find out what might cause it. Either inductive or deductive reasoning is applied. In the case of software hazards, the usual focus is to determine faults that will cause the system to fail to deliver a system service, such as a monitoring system. A "fault tree" is constructed to link all the possible situations together, to help identify the interrelationships of the failures, which modules may cause them, and what "trickle-down effects" there might be. Here is an example of a fault tree, as applied to the Insulin delivery system from Sommerville...
Note that this tree is only partially complete, since only the potential software faults are shown on the diagram. The potential failures involving hardware, such as low battery, blood monitor or sensor failure, patient over-exertion or inattention, or medical staff failure are noticeable by their absence.
The fault tree and safety specification processes are two ways of helping with system risk assessment tasks. Once the risks are identified, there are other assessments that need to take place. First, the likelihood of the risk occurrance must be assessed. This is often quantifiable, so numbers may be assigned based on things like MTBF, latency effects, and other known entities. There may be other non-quantifiable contributors to the risk likelihood, however, such that these must be assessed and estimated by experts in the domain. (Don't short-change this process when dealing with critical systems!) Finally, the risk assessment must include the severity of the risk, meaning an estimation of the cost to the project in the event the risk item actually does occur. "Cost to the project" means all associated costs, including schedule delays, human injury, damage to hardware, corruption of data, and so on."
[myweb.lmu.edu/ bjohnson/ cmsi641web/ week15-2.html]
The FTA diagram example "Fault tree analysis - Insulin delivery system" was created using the ConceptDraw PRO diagramming and vector drawing software extended with the Fault Tree Analysis Diagrams solution from the Engineering area of ConceptDraw Solution Park.
FTA diagram

 DOM Tree
DOM Tree solution extends the functionality of ConceptDraw DIAGRAM and ConceptDraw MINDMAP software making them ideal for designing the Document Object Model, DOM hierarchy and DOM tree diagram. You are free to choose — design your DOM document object model in ConceptDraw DIAGRAM or create the DOM Tree Mind Map in ConceptDraw MINDMAP and then automatically generate it to DOM tree diagram in ConceptDraw DIAGRAM file. This solution includes a lot of samples and predesigned vector shapes, smart and direct connectors for fast and easy drawing strict, informative and professional-looking DOM model, DOM trees, DOM hierarchies, DOM document structures, and DOM Tree Mind Maps.
ConceptDraw Arrows10 Technology

Add some additional words to this card and place it on a gift.
The example "New Year Card - Christmas Tree with Gifts" was created in the ConceptDraw PRO diagramming and vector drawing software using the vector clipart library "Christmas and New Year".
Use the design elements library "Christmas and New Year" to create your own unique greeting cards, presentation slides or high-resolution images that you can post to social networks, blogs and websites, send by e-mail, or print.
The example "New Year Card - Christmas Tree with Gifts" and the vector stencils library "Christmas and New Year" are included in the Holiday Solution from the Illustration area of ConceptDraw Solution Park.
Vector illustration

 Fault Tree Analysis Diagrams
This solution extends ConceptDraw DIAGRAM.5 or later with templates, fault tree analysis example, samples and a library of vector design elements for drawing FTA diagrams (or negative analytical trees), cause and effect diagrams and fault tree diagrams.
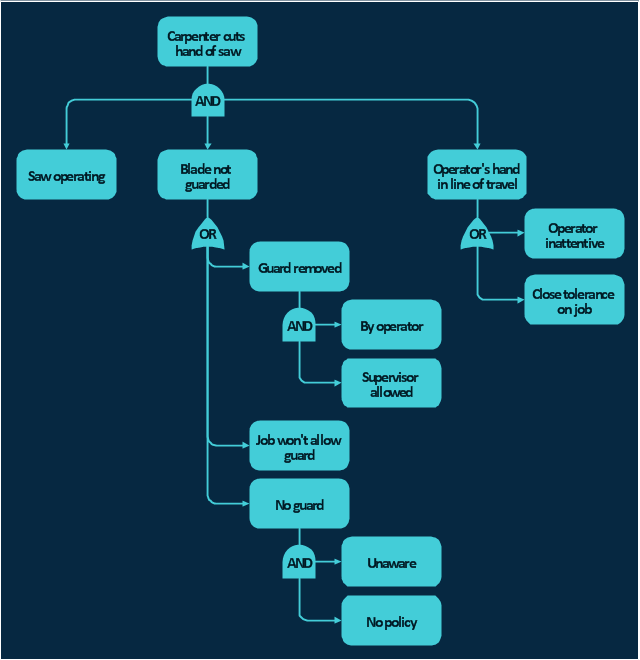
The FTA diagram example "Hazard analysis" was redesigned from the illustration of the article "Hazard Analysis Methodologies" from the Occupational Safety & Health Administration (OSHA) website.
"A fault tree analysis is a quantitative assessment of all of the undesirable outcomes, such as a toxic gas release or explosion, which could result from a specific initiating event. It begins with a graphic representation (using logic symbols) of all possible sequences of events that could result in an incident. The resulting diagram looks like a tree with many branches — each branch listing the sequential events (failures) for different independent paths to the top event. Probabilities (using failure rate data) are assigned to each event and then used to calculate the probability of occurrence of the undesired event. ...
This technique is particularly useful in evaluating the effect of alternative actions on reducing the probability of occurrence of the undesired event."
[osha.gov/ SLTC/ etools/ safetyhealth/ mod4_ tools_ methodologies.html]
The FTA diagram example "Hazard analysis" was created using the ConceptDraw PRO diagramming and vector drawing software extended with the Fault Tree Analysis Diagrams solution from the Engineering area of ConceptDraw Solution Park.
FTA diagram
The New Year card template "Christmas tree red balls" for the ConceptDraw PRO diagramming and vector drawing software is included in the Holiday Solution from the Illustration area of ConceptDraw Solution Park.
Vector illustration

The New Year card template "Santa Claus near a Christmas Tree" for the ConceptDraw PRO diagramming and vector drawing software is included in the Holiday Solution from the Illustration area of ConceptDraw Solution Park.
Vector illustration

Add a bright slide to your presentation - Season’s greetings will make winter days warm and cheerful.
The New Year card template "Christmas snowflakes and presents" for the ConceptDraw PRO diagramming and vector drawing software is included in the Holiday Solution from the Illustration area of ConceptDraw Solution Park.
The New Year card template "Christmas snowflakes and presents" for the ConceptDraw PRO diagramming and vector drawing software is included in the Holiday Solution from the Illustration area of ConceptDraw Solution Park.
Vector illustration

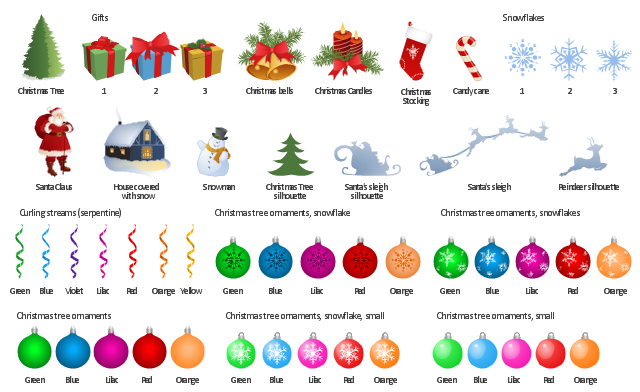
The vector stencils library "Christmas and New Year" contains 50 clipart images for drawing Christmas and New Year greeting cards and illustrations.
"A greeting card is an illustrated, folded card featuring an expression of friendship or other sentiment. Although greeting cards are usually given on special occasions such as birthdays, Christmas or other holidays, they are also sent to convey thanks or express other feeling. Greeting cards, usually packaged with an envelope, come in a variety of styles. There are both mass-produced as well as handmade versions that are distributed by hundreds of companies large and small. While typically inexpensive, more elaborate cards with die-cuts or glued-on decorations may be more expensive. ...
Electronic Greeting Cards: (also called E-cards).
Greeting cards can also be sent electronically. Flash-based cards can be sent by email, and many sites such as Facebook enable you to send greetings. More recently, services have launched which enable you to send greetings to a mobile phone by text message. Many of these electronic services offer open or anonymous chat, to enable further discussion." [Greeting card. Wikipedia]
The clip art example "Christmas and New Year - Vector stencils library" was created using the ConceptDraw PRO diagramming and vector drawing software extended with the Holiday Solution from the Illustration area of ConceptDraw Solution Park.
www.conceptdraw.com/ solution-park/ illustrations-holiday
Christmas tree

Christmas tree silhouette

Gift 1

Gift 2

Gift 3

Christmas stocking

Christmas bells

Snowman

Snowflake 1

Snowflake 2

Snowflake 3

Curling stream, green

Curling stream, blue

Curling stream, violet

Curling stream, lilac

Curling stream, red

Curling stream, orange

Curling stream, yellow

Candy cane

Сhristmas candles

House covered with snow

Santa's sleigh silhouette

Reindeer silhouette

Santa's sleigh

Santa Claus

Christmas tree ornament, snowflake, blue

Christmas tree ornament, snowflake, red

Christmas tree ornament, snowflake, lilac

Christmas tree ornament, snowflake, orange

Christmas tree ornament, snowflake, green
Christmas tree ornament, snowflakes, red

Christmas tree ornament, snowflakes, blue

Christmas tree ornament, snowflakes, lilac

Christmas tree ornament, snowflakes, orange

Christmas tree ornament, snowflakes, green

Christmas tree ornament, blue

Christmas tree ornament, red

Christmas tree ornament, lilac

Christmas tree ornament, orange

Christmas tree ornament, green
Christmas tree ornament, snowflake, blue, small

Christmas tree ornament, snowflake, red, small

Christmas tree ornament, snowflake, lilac, small

Christmas tree ornament, snowflake, orange, small

Christmas tree ornament, snowflake, green, small

Christmas tree ornament, blue, small

Christmas tree ornament, red, small

Christmas tree ornament, lilac, small

Christmas tree ornament, orange, small

Christmas tree ornament, green, small

Decision Tree Analysis

The ConceptDraw DIAGRAM diagramming and drawing software is the one that can help with creating the needed drawing, including a decision tree. Making decision tree analysis, it is always easy to make the needed matrix as there are plenty of pre-made templates to be used.
 Class Hierarchy Tree
Class Hierarchy Tree solution enhances the ConceptDraw DIAGRAM and ConceptDraw MINDMAP software functionalities with a wide collection of samples and a large set of pre-made vector shapes, smart and direct connectors allowing all IT and web specialists, web-designers, web-programmers, and lecturers to design the Class Hierarchy Trees and Class Diagrams, object oriented classes, making easier the object oriented programming, illustrating the object oriented programming concepts, the generalization and inheritance in Java class and Python class, as well as designing the Class Hierarchy Mind Maps and autogenerating them in Class Tree Diagrams in ConceptDraw DIAGRAM files.
"Snowboarding at the 2014 Winter Olympics in Sochi will be held at the Rosa Khutor Extreme Park. The events will be held between 6 and 22 February 2014. A total of ten snowboarding events will be held at Sochi 2014 which will include parallel giant slalom, snowboard cross, half-pipe, and the new events of parallel slalom and slopestyle. ...
Men's slopestyle.
Women's slopestyle.
Men's halfpipe.
Women's halfpipe.
Women's snowboard cross.
Men's snowboard cross.
Men's and Women's parallel giant slalom.
Men's and Women's parallel slalom.
A total of 252 quota spots are available to athletes to compete at the games. A maximum of 24 athletes can be entered by a National Olympic Committee, with a maximum of 14 men or 14 women. The five different events have different quota amounts allocated to them. Countries are allowed to enter the same athlete into more then one event, further reducing the amount of athletes competing. ...
31 nations are scheduled to participate, with number of athletes in parenthesis." [Snowboarding at the 2014 Winter Olympics. Wikipedia]
The vector illustration "Winter Olympics - Snowboard" was created using the ConceptDraw PRO diagramming and vector drawing software extended with the Winter Sports solution. The Winter Sports solution from the Sport area of ConceptDraw Solution Park contains the Sochi 2014 Winter Olimpics sports vector pictograms and clipart libraries and examples of diagrams, illustrations and infographics.
Vector clip art

 Family Tree
Family Tree solution with included vector design shapes for drawing family trees, pedigree chart symbols, photo blocks of different detailing and professionally designed samples, extends the functionality of ConceptDraw DIAGRAM software making it the best family tree maker and easy-to-use ancestry trees designer program for researchers, scientists, historians, genetics, medics, archeologists, and other stakeholders. Use it to design informative and colorful genealogy trees, simple family tree or extensive ancestry tree of any depth, genealogy schematics and illustrations with family trees.
"Cross-country skiing at the 2014 Winter Olympics will be held at the Laura Biathlon & Ski Complex near Krasnaya Polyana, Russia. The ten events are scheduled for February 8–23, 2014.
Women's skiathlon;
Men's skiathlon;
Individual sprint free men/ women;
Women's 10 km classical;
Men's 15 km classical;
4 x 5 km relay women;
4 x 10 km relay men;
Team sprint classical men/ women;
Women's 30 km mass start free;
Men's 50 km mass start free.
A total of 310 quota spots are available to athletes to compete at the games. A maximum of 20 athletes can be entered by a National Olympic Committee, with a maximum of 12 men or 12 women. There are two qualification standards for the games: an A standard and a B standard." [Cross-country skiing at the 2014 Winter Olympics. Wikipedia]
The vector illustration "Winter Olympics - Cross-country skiing" was created using the ConceptDraw PRO diagramming and vector drawing software extended with the Winter Sports solution. The Winter Sports solution from the Sport area of ConceptDraw Solution Park contains the Sochi 2014 Winter Olimpics sports vector pictograms and clipart libraries and examples of diagrams, illustrations and infographics.
Clip art

Scrum

Cisco Network Diagram Software

The vector stencils library "Christmas and New Year" contains 50 clipart images of Christmas tree, Santa Claus, gifts, Christmas bells, candy cane, Christmas candles, Christmas stocking, house covered with snow, snowman, Santa's sleigh silhouette, reindeer silhouette, Santa sleigh, snowflakes, curling streams (serpentine), Christmas tree ornaments.
Use the design elements library Christmas and New Year to create your own unique greeting cards, presentation slides or high-resolution images using the ConceptDraw PRO diagramming and vector drawing software.
The vector stencils library "Christmas and New Year" is included in the Holiday Solution from the Illustration area of ConceptDraw Solution Park.
Vector clip art
HelpDesk
How to Create a DOM Tree Diagram

Family Tree

- Audit failure - Fault tree analysis diagram | Root cause analysis tree ...
- Fault Tree Diagram | Fault Tree Analysis Software | ConceptDraw ...
- Fault Tree Diagram | Fault Tree Analysis Software | Fault Tree ...
- Fault Tree Analysis Examples And Solutions
- Fault Tree Analysis Diagrams | Fault Tree Analysis Software
- Fault Tree Analysis Software - Conceptdraw.com
- Fault Tree Analysis Software | Design elements - Fault tree analysis ...
- Fault Tree Analysis Software - Insulin delivery system
- Fault Tree Analysis Software | FTA diagram | Probability For Gate
- Decision Tree Analysis