Management Tools — Total Quality Management

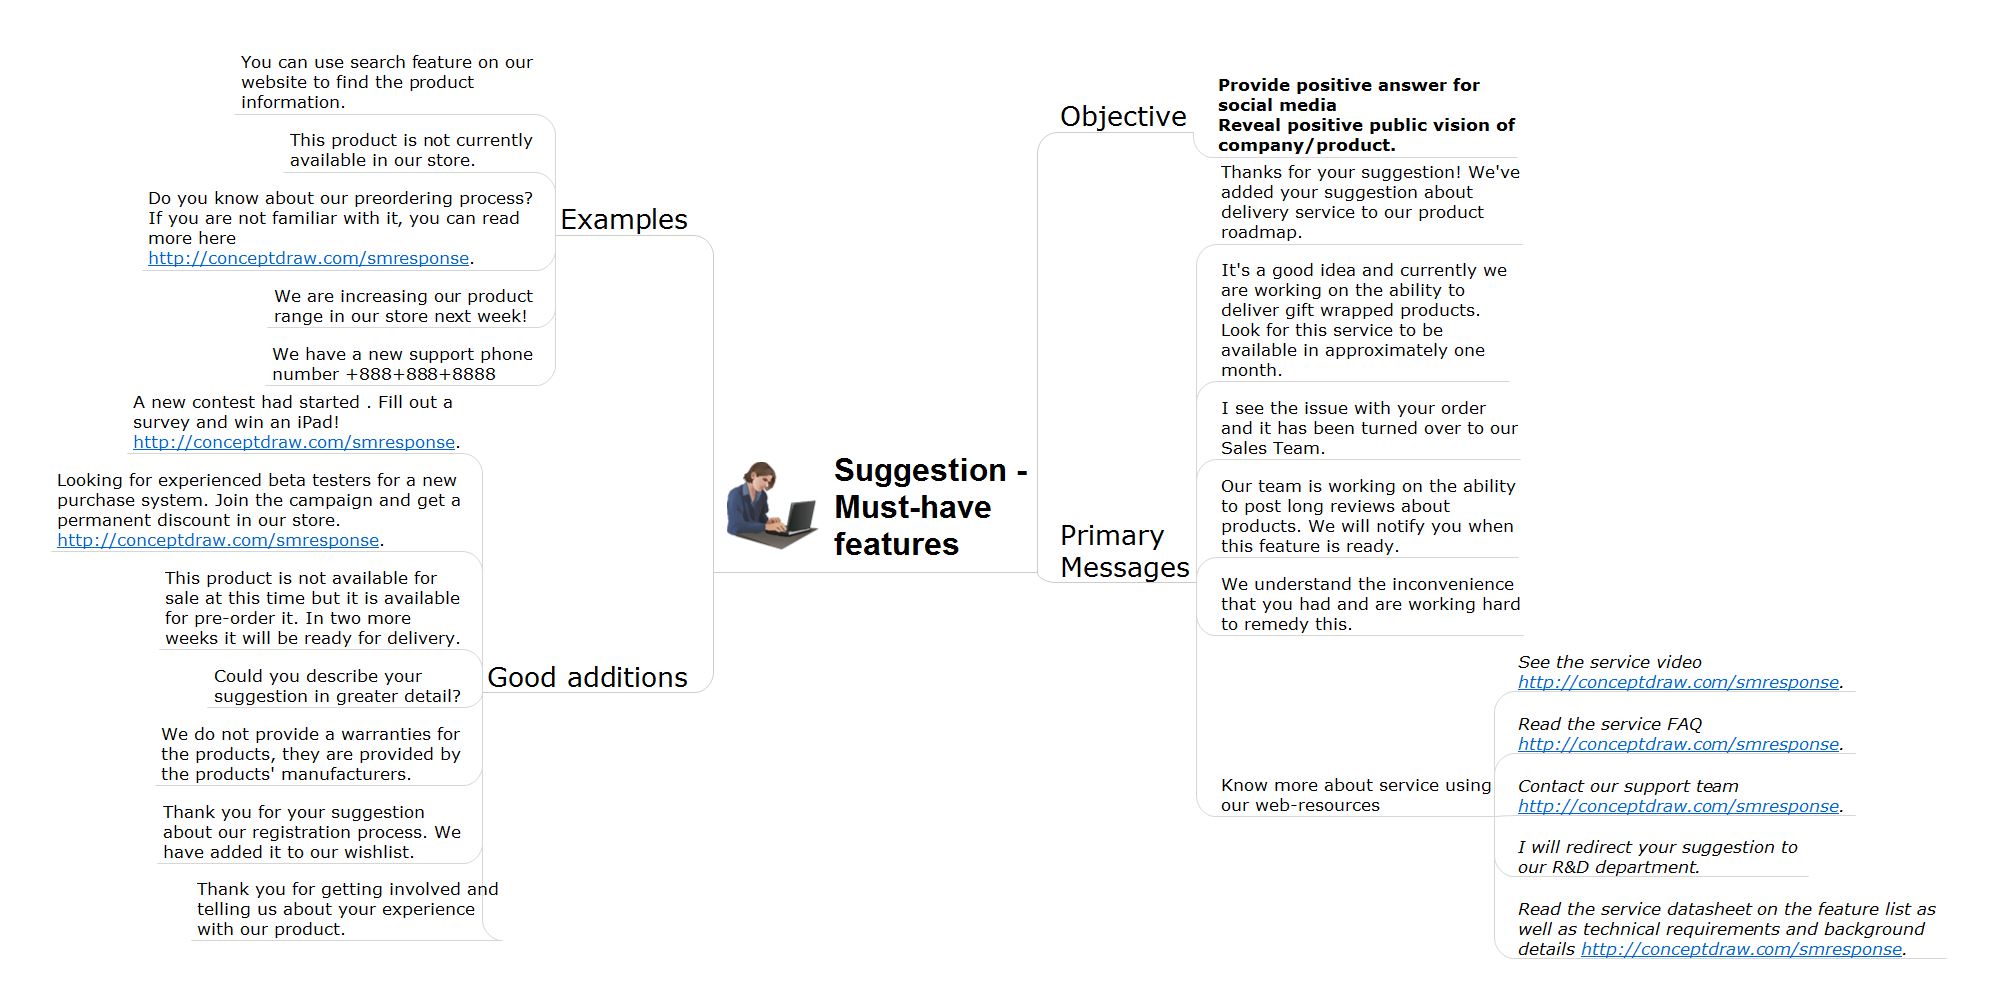
 Social Media Response
This solution extends ConceptDraw DIAGRAM and ConceptDraw MINDMAP with the ability to draw interactive flow charts with action mind map templates, to help create an effective response to applicable social media mentions.
Pyramid Diagram

Venn Diagram Examples for Problem Solving. Environmental Social Science. Human Sustainability Confluence

Best Program to Create a Fowchart

How to Present Workflow to Team
 MindTweet
This solution extends ConceptDraw MINDMAP software with the ability to brainstorm, review and organize the sending of Tweets.
 Bubble Diagrams
Bubble diagrams have enjoyed great success in software engineering, architecture, economics, medicine, landscape design, scientific and educational process, for ideas organization during brainstorming, for making business illustrations, presentations, planning, design, and strategy development. They are popular because of their simplicity and their powerful visual communication attributes.
- UML Use Case Diagram Example Social Networking Sites Project ...
- Venn Diagram Examples for Problem Solving. Environmental Social ...
- UML Use Case Diagram Example Social Networking Sites Project ...
- Social strategy - Pyramid diagram | Social determinants of health ...
- Venn Diagram Examples for Problem Solving. Environmental Social ...
- ConceptDraw | Press Releases
- Marketing plan - Circular diagram | Marketing Diagrams | Internet ...
- Social strategy - Pyramid diagram | Diagram Of Social Pyramid
- How to Create a Social Media DFD Flowchart | Internet marketing ...
- Venn Diagram Examples for Problem Solving. Environmental Social ...