Soccer (Football) Diagram Software
Explaining the soccer strategies and techniques is practically impossible without drawing a diagram. ConceptDraw PRO diagramming and vector drawing software extended with Soccer solution from the Sport area of ConceptDraw Solution Park is a very convenient and useful tool for designing the soccer-related diagrams.Soccer (Football) Illustrated
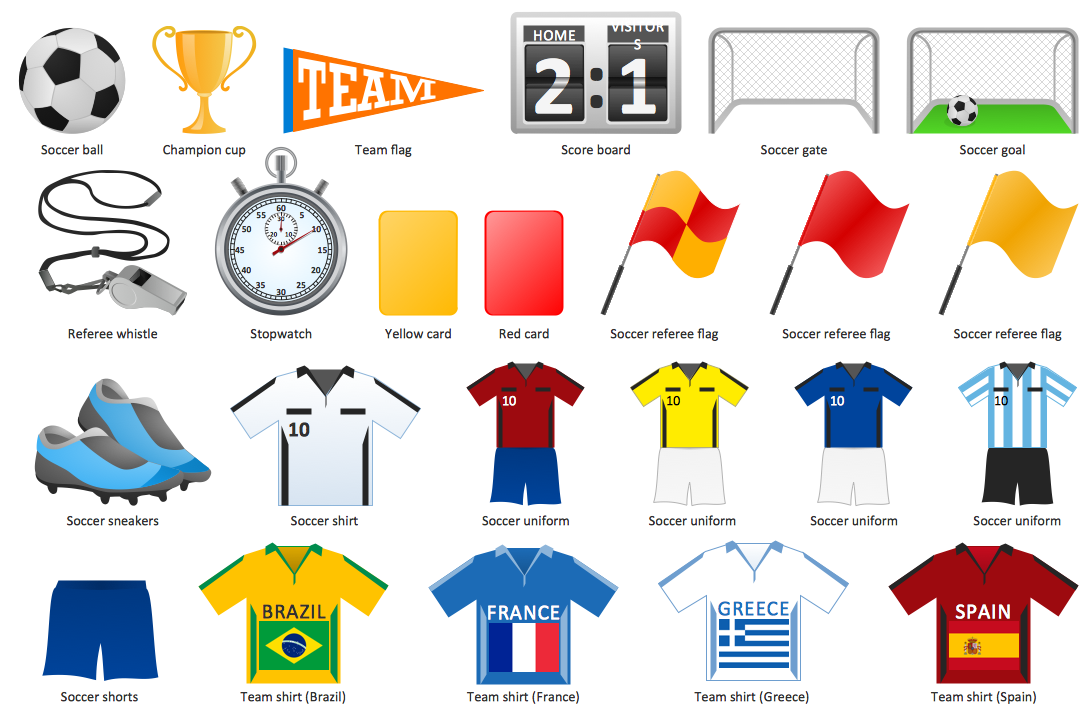
It’s very important that your soccer drawing looked beautiful, interesting and attracted the attention. For this it is necessary add the illustrations! The Soccer solution delivers several libraries with predesigned bright and interesting clipart objectsHelpDesk
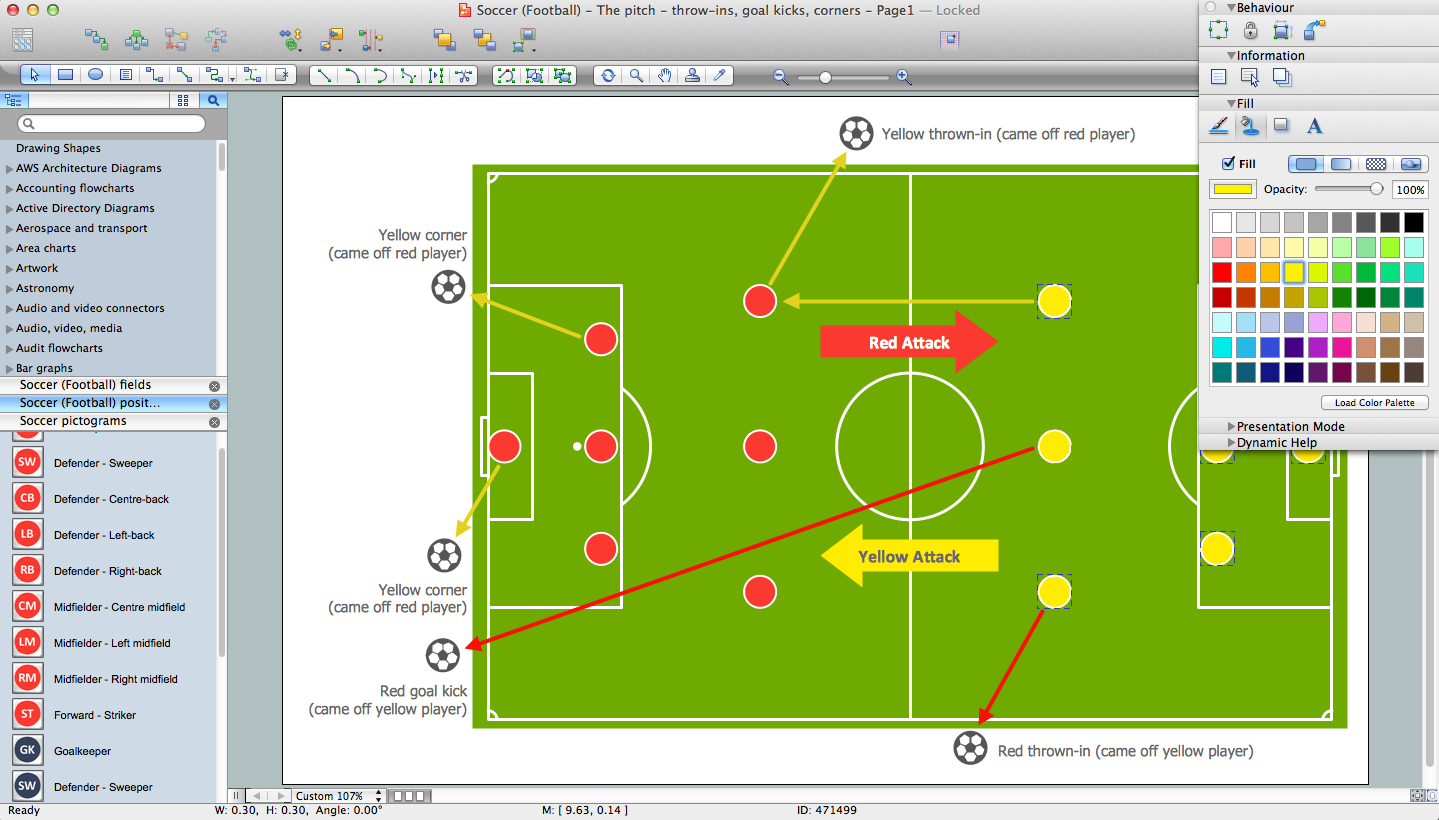
How to Make Soccer Position Diagram Using ConceptDraw PRO
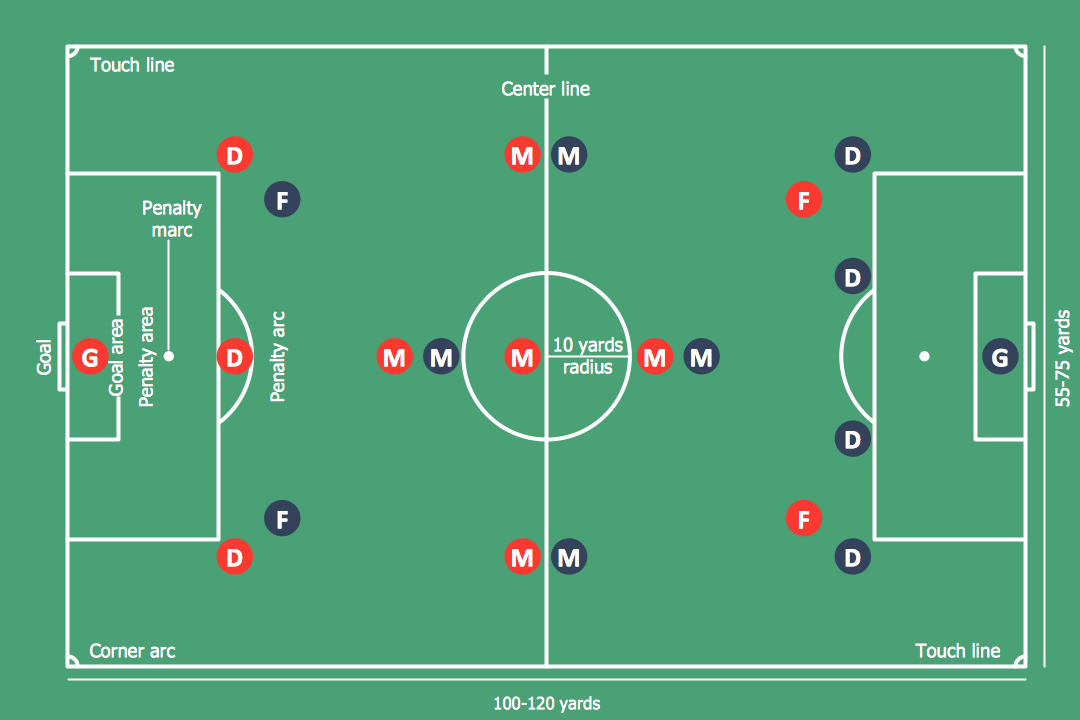
The soccer field has the form of a large rectangle, covered with grass. Dimensions of soccer fields may vary slightly, depending on the level of the game, but all fields have some common characteristics. Soccer players may take different positions. Each soccer position has its own name, and implies certain player functions. Every soccer position has a very specific name and task: Goalkeeper, Defenders, Midfielders and Forwards. During preparation for the game coach met a challenge: how to explain each player's position and his role in the game. The difficulty is the fact that in the course of the game players will often move on the field and do not stay in one place. Football field diagram with dimensions and marking, and positions - it is an important tool for the coach. ConceptDraw PRO helps both coach and players to understand exactly their roles during the particular game. The ability to create Soccer diagrams is contained in the ConceptDraw Soccer solution. The solution providesSoccer (Football) Positions
Explaining soccer positions becomes much more easier and time saving with visual drawings. ConceptDraw PRO software extended with the Soccer solution from the Sport area of ConceptDraw Solution Park is very useful tool that will help you design the soccer-related drawings of any complexity in minutes.HelpDesk
Accounting Information Systems Flowchart Symbols
Accounting Information system is a combination of software and hardware, as well as organizational support. Information system - it is not only the software and computers with network equipment, but also a list of instructions and standards which can be notated using Accounting information systems flowchart symbols. All information systems can be divided into information retrieval and data processing systems. Data Flow model is a hierarchical model. Each process can be divided into structural components, that depict by corresponding flowchart symbols, showing the accounting information system in communication with the external environment. The major components of accounting information systems flowchart are: entities, processes, data stores, and data flows. The set of standard accounting information flowchart symbols is intended to show the relationships between the system components. ConceptDraw PRO can help to draw clear accounting information system diagrams using special flowchart symbols.Offensive Play – Double Wing Wedge – Vector Graphic Diagram
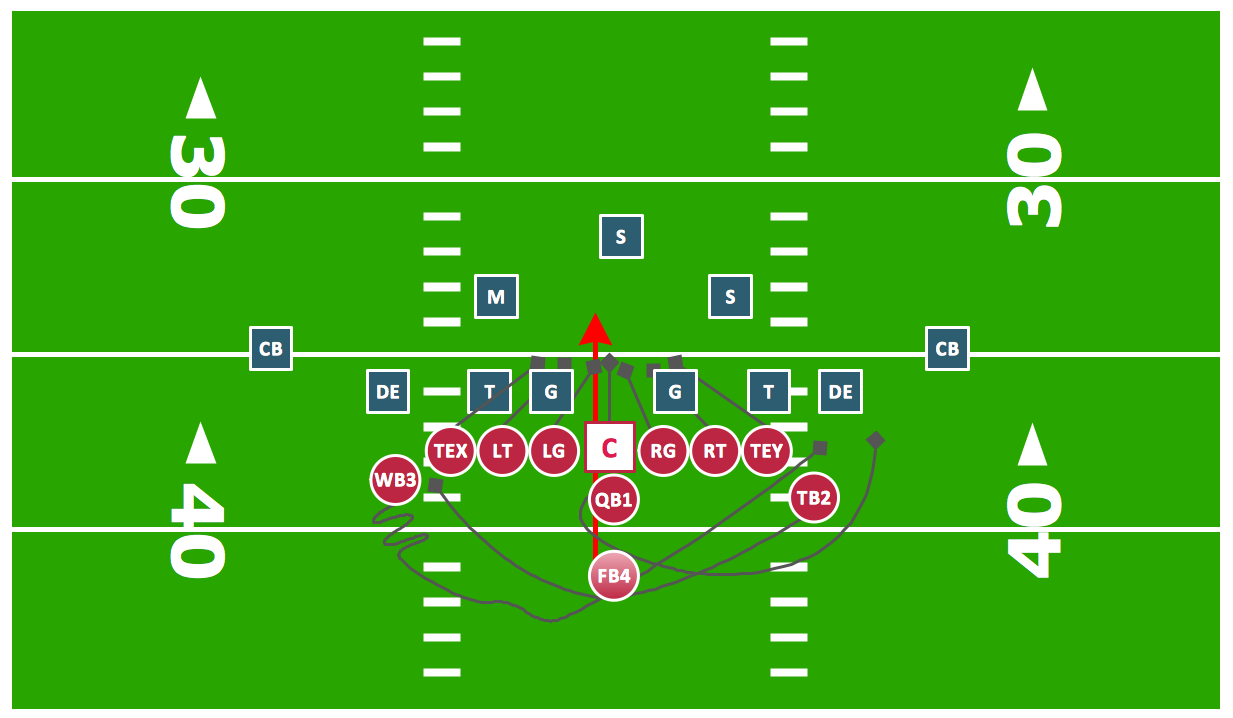
Producing football diagrams using ConceptDraw PRO software takes seconds, not minutes. Thanks to Football solution from the Sport area of ConceptDraw Solution Park all you need is just drag and drop ready-to-use positions objects to a template contains football field, and place positions on the field.Ice Hockey Diagram – Penalty Kill Forecheck Angling Drill
ConceptDraw Ice Hockey solution is a good tool to think about complex things. You don't need a software during hockey match, of course. Drawing software helps to plan strategy and tactics before a match, and then analyze mistakes and results.
 Computer and Networks Area
The solutions from Computer and Networks Area of ConceptDraw Solution Park collect samples, templates and vector stencils libraries for drawing computer and network diagrams, schemes and technical drawings.
 Metro Map
Metro Map solution extends ConceptDraw PRO software with templates, samples and library of vector stencils for drawing the metro maps, route maps, bus and other transport schemes, or design tube-style infographics.
HelpDesk
How to Use a Cross - Functional Flowcharts Solution
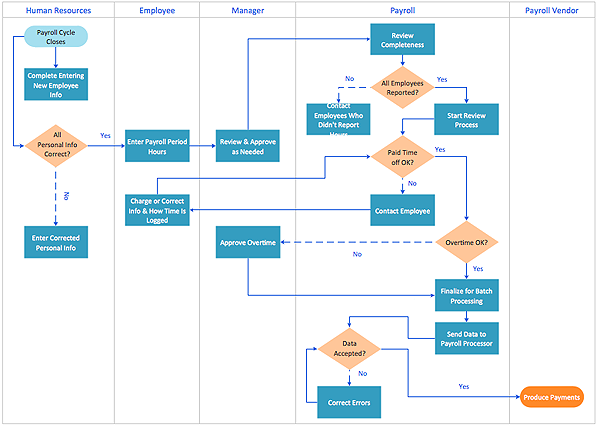
Cross-functional process is a process that involves multiple divisions, each of which makes its part of the entire company workflow. For example: product development, lead management , client orders processing – and other critical processes. Using a Cross-Functional flowchart is a clear way of showing each team member’s responsibilities and how processes get shared or transferred between different teams and departments.The Cross-Functional flowchart is a clear way to visualize the document flow in your organization. The ability to create Cross-functional diagrams is provided by the Cross-Functional Flowcharts solution.
- Diagram Of The Football Field Or Picth Showing All Necessary ...
- Soccer (Football) Positions | Soccer (Football) Formation | Soccer ...
- Photo Of Soccer Positions
- Soccer (Football) Tactics | Design a Soccer (Football) Field | Soccer ...
- Soccer (Football) Illustrated | Create Soccer (Football) Positions ...
- Basketball Plays Software | How to Make Soccer Position Diagram ...
- Soccer (Football) Positions | I Formation (Offense) Diagram | Soccer ...
- Soccer (Football) Positions | I Formation (Offense) Diagram | Soccer ...
- Soccer (Football) Positions | Soccer (Football) Formation ...
- Draw A Diagram Of Soccer
- Soccer (Football) Illustrated | Offensive Play – Double Wing Wedge ...
- Soccer (Football) Formation | Soccer (Football) Positions | Baseball ...
- Soccer (Football) Positions | Basketball Field in the Vector | Baseball ...
- 3-4 Defense Diagram | Soccer (Football) Diagram Software | Soccer ...
- Soccer (Football) Positions | Baseball Diagram – Colored Baseball ...
- Ice Hockey Rink Dimensions | Ice Hockey Offside Diagram | Soccer ...
- Soccer (Football) Field Templates | Soccer | Soccer (Football ...
- Soccer (Football) Positions | I Formation (Offense) Diagram | Soccer ...
- Soccer (Football) Positions | Soccer (Football) Formation ...
- Soccer (Football) Formation | Soccer (Football) Tactics | Offensive ...
