SWOT Matrix Template

UML Activity Diagram

The vector stencils library "Picture Graphs" contains 35 templates of picture bar graphs for visual data comparison and time series.
Drag a template from the library to your document, set bars number, type category labels, select bars and enter your data.
Use these shapes to draw your pictorial bar charts in the ConceptDraw PRO diagramming and vector drawing software.
The vector stencils library "Picture Graphs" is included in the Picture Graphs solution from the Graphs and Charts area of ConceptDraw Solution Park.
Arrow
Water drop

Food

Grain

Agriculture

Medicines

Houses

Buildings

Money bags

Oil barrels

Natural gas

Electrical power

Nuclear power

Mechanical engineering

Chemical industry

Mining

Gold bars

Coins

Person

Men, women and children

Man

Woman

Child

Milk

Meat

Fruits

Vegetables

Computer

Mobile phone

Airliner

Car

Bus

Truck

Train

Cargo ship

.png--diagram-flowchart-example.png)
 Continent Maps
Continent Maps solution extends ConceptDraw DIAGRAM software with templates, samples and libraries of vector stencils for drawing the thematic maps of continents, state maps of USA and Australia.
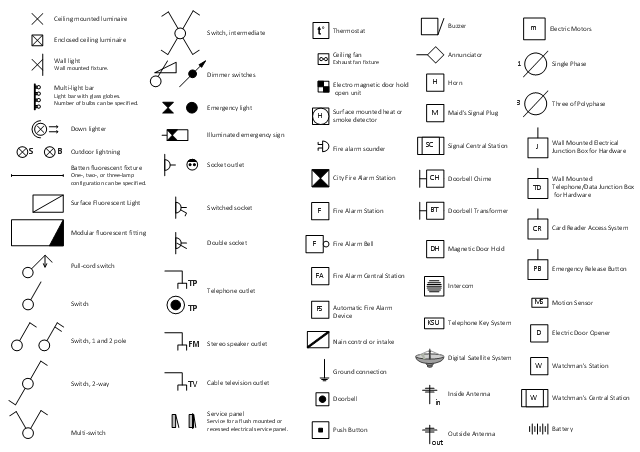
The vector stencils library "Electrical and telecom" contains 83 symbols of electrical and telecommunication equipment for electrical drawings and wiring diagrams of buildings, communication centers, power plants and electrical distribution systems.
"An electrical drawing, is a type of technical drawing that shows information about power, lighting, and communication for an engineering or architectural project." [Electrical drawing. Wikipedia]
Use the design elements library "Electrical and telecom" to design your own electrical drawings, plot plans of the building outside electrical wiring, floor plans with electrical and telecommunication systems layout, power-riser diagrams with panel boards, control wiring diagrams and cabling layout schemes, reflected ceiling plans and lighting panels layouts using the ConceptDraw PRO diagramming and vector drawing software.
The shapes library "Electrical and telecom" is included in the Electric and Telecom Plans solution from the Building Plans area of ConceptDraw Solution Park.
Electrical and telecom symbols
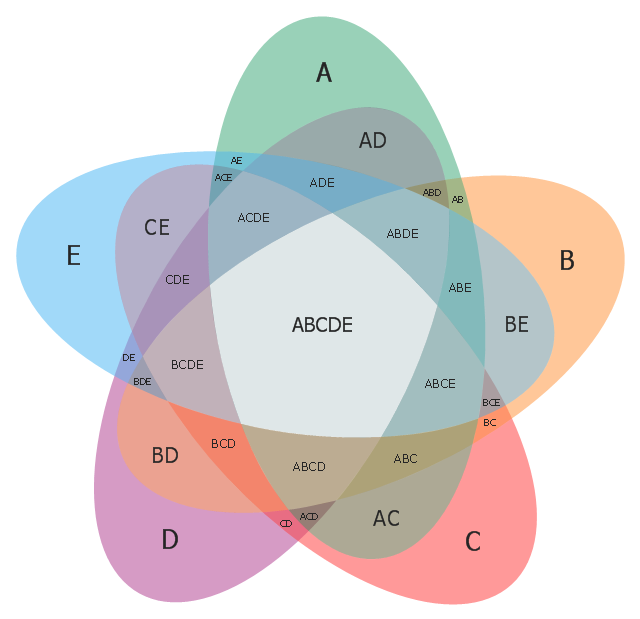
Use this template to design your five set Venn diagrams.
"Five-set Venn diagram using congruent ellipses in a radially symmetrical arrangement devised by Branko Grünbaum. Labels have been simplified for greater readability." [Venn diagram. Wikipedia]
The template "5-set Venn diagram" for the ConceptDraw PRO diagramming and vector drawing software is included in the Venn Diagrams solution from the area "What is a Diagram" of ConceptDraw Solution Park.
Template
Design Element: Crows Foot for Entity Relationship Diagram - ERD

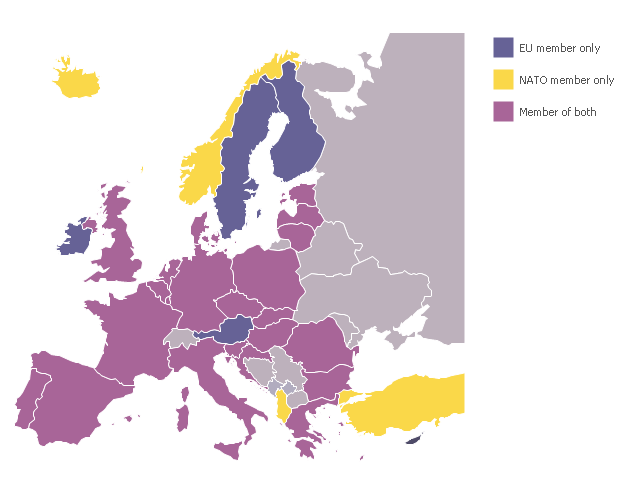
A map showing European membership of the EU and NATO.
"The European Union (EU) is an economic and political union of 28 member states that are located primarily in Europe.
The EU operates through a system of supranational independent institutions and intergovernmental negotiated decisions by the member states. Institutions of the EU include the European Commission, the Council of the European Union, the European Council, the Court of Justice of the European Union, the European Central Bank, the Court of Auditors, and the European Parliament. The European Parliament is elected every five years by EU citizens. The EU's de facto capital is Brussels." [European Union. Wikipedia]
"The principal military alliance in Europe remains NATO, which includes 21 of all EU member states as well as other non-EU European countries, Turkey, the United States and Canada." [Military of the European Union. Wikipedia]
"The North Atlantic Treaty Organization (NATO), also called the (North) Atlantic Alliance, is an intergovernmental military alliance based on the North Atlantic Treaty which was signed on 4 April 1949. The organization constitutes a system of collective defence whereby its member states agree to mutual defense in response to an attack by any external party. NATO's headquarters are in Brussels, Belgium, one of the 28 member states across North America and Europe, the newest of which, Albania and Croatia, joined in April 2009." [NATO. Wikipedia]
This Europe map example was redesigned using the ConceptDraw PRO diagramming and vector drawing software from the Wikimedia Commons file: EU and NATO.svg.
[commons.wikimedia.org/ wiki/ File:EU_ and_ NATO.svg]
The Europe political map example "European membership of the EU and NATO map" is included in the Continent Maps solution from the Maps area of ConceptDraw Solution Park.
Political map - EU and NATO
This cause and effect diagram sample was redesigned from the Wikimedia Commons file: Fishbone BadCoffeeExample.jpg. [commons.wikimedia.org/ wiki/ File:Fishbone_ BadCoffeeExample.jpg]
This file is licensed under the Creative Commons Attribution-Share Alike 3.0 Unported license. [creativecommons.org/ licenses/ by-sa/ 3.0/ deed.en]
The fishbone diagram example "Bad coffee" was created using the ConceptDraw PRO diagramming and vector drawing software extended with the Fishbone Diagrams solution from the Management area of ConceptDraw Solution Park.
Fishbone diagram

This picture bar graph sample shows regional population growth from 2010 to 2016. It was designed using data from the Wikipedia article List of continents by population.
[en.wikipedia.org/ wiki/ List_ of_ continents_ by_ population]
"Population geography is a division of human geography. It is the study of the ways in which spatial variations in the distribution, composition, migration, and growth of populations are related to the nature of places. Population geography involves demography in a geographical perspective. It focuses on the characteristics of population distributions that change in a spatial context." [Population geography. Wikipedia]
The pictorial chart example "Regional population growth from 2010 to 2016" was created using the ConceptDraw PRO diagramming and vector drawing software extended with the Picture Graphs solution from the Graphs and Charts area of ConceptDraw Solution Park.
Image chart

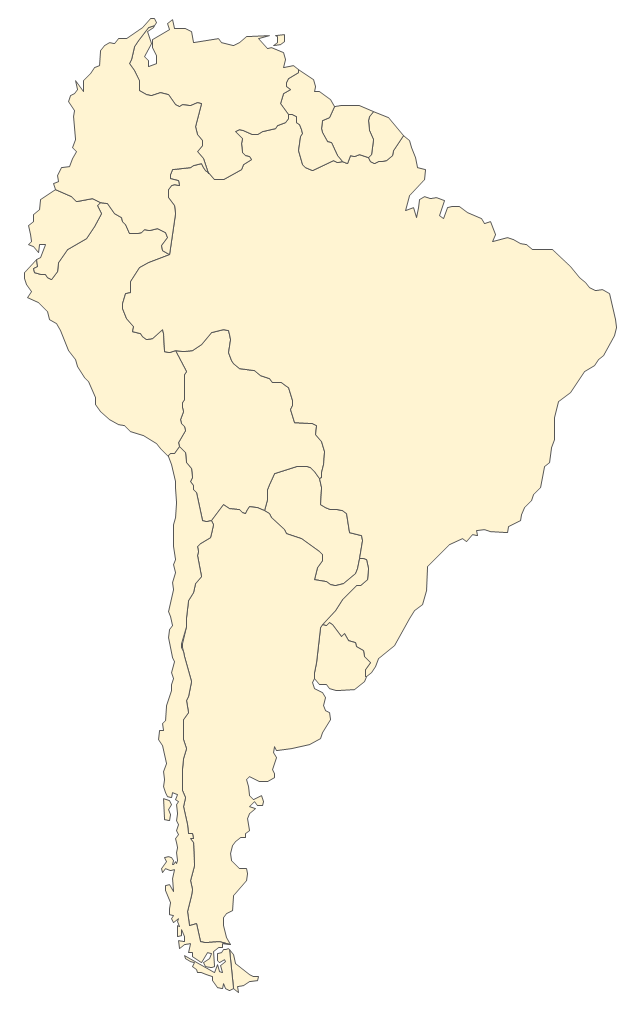
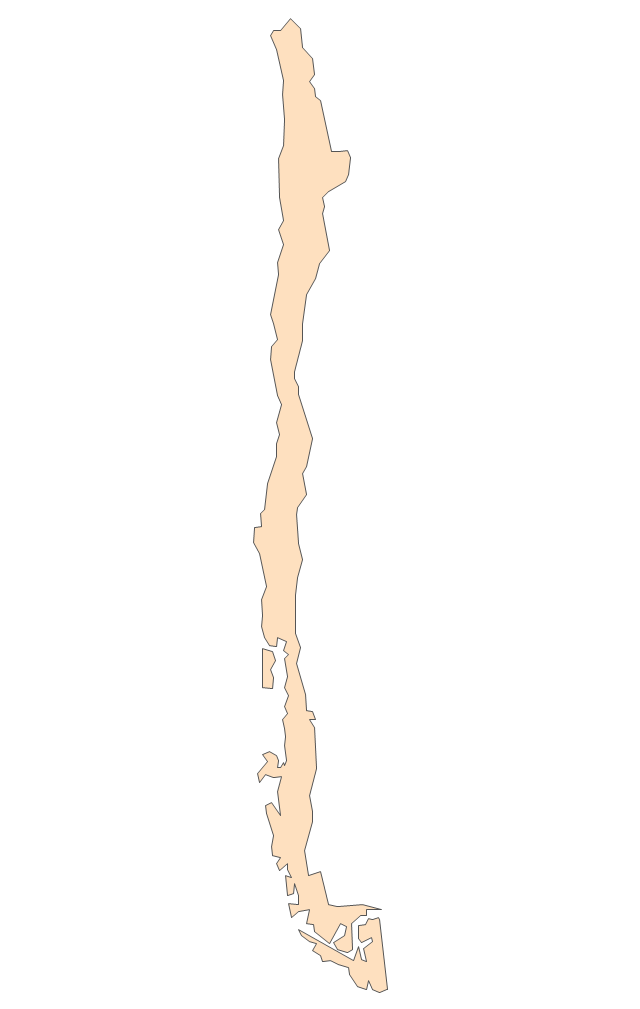
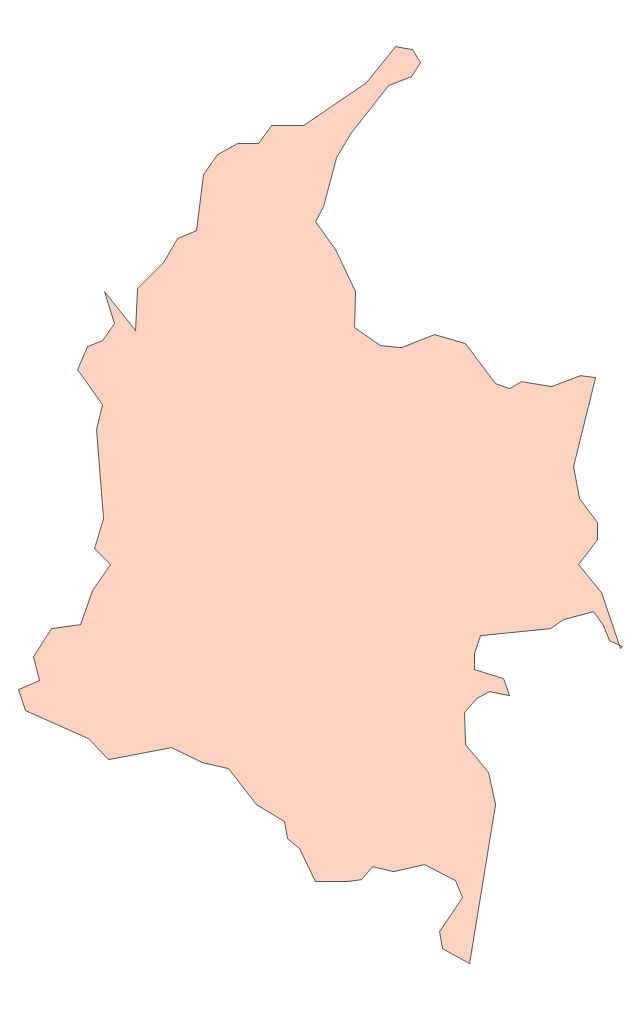
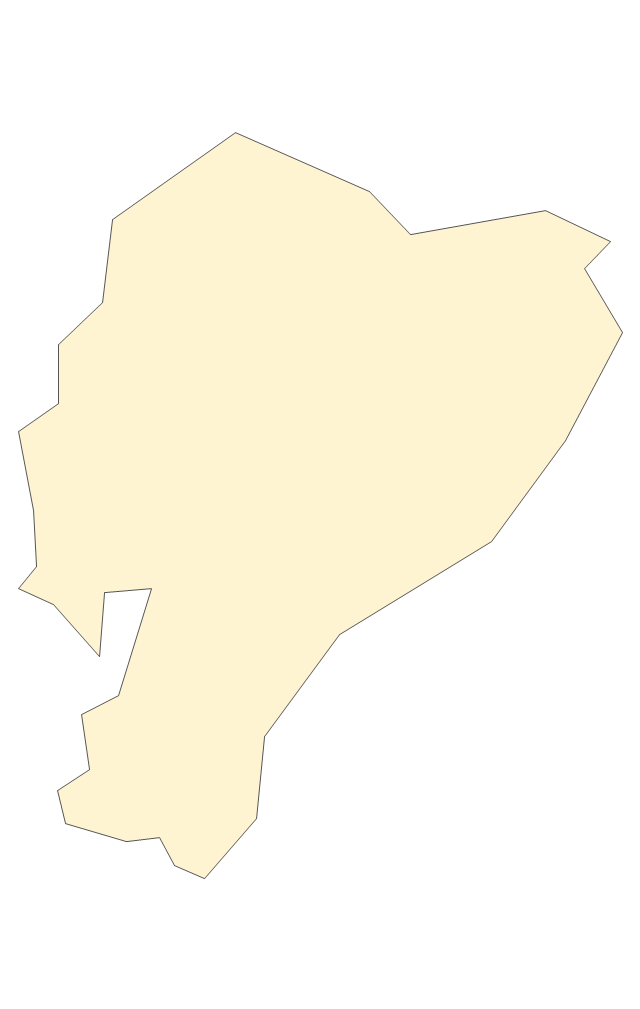
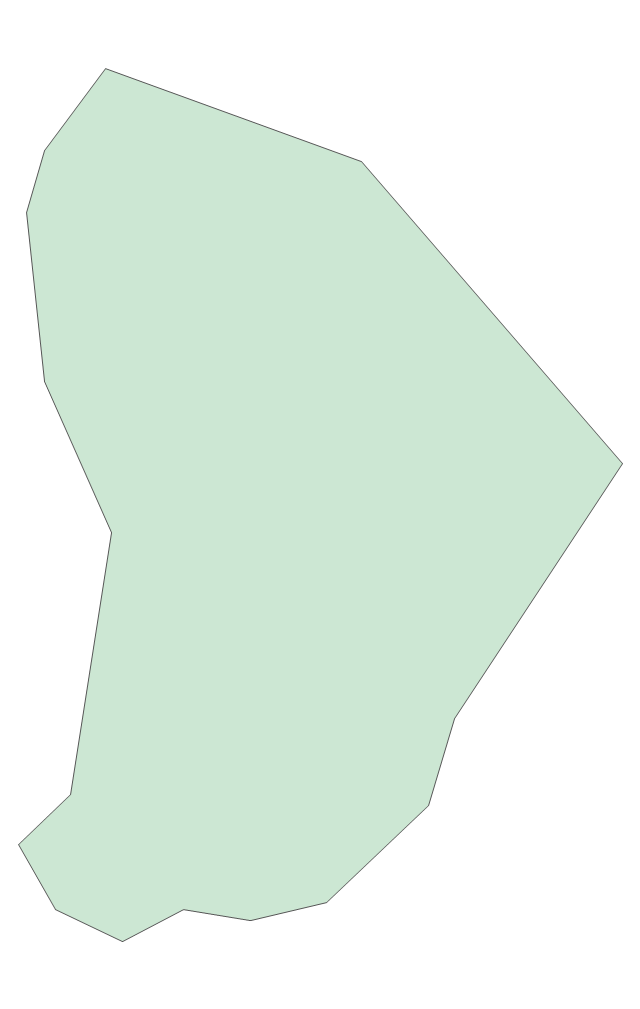
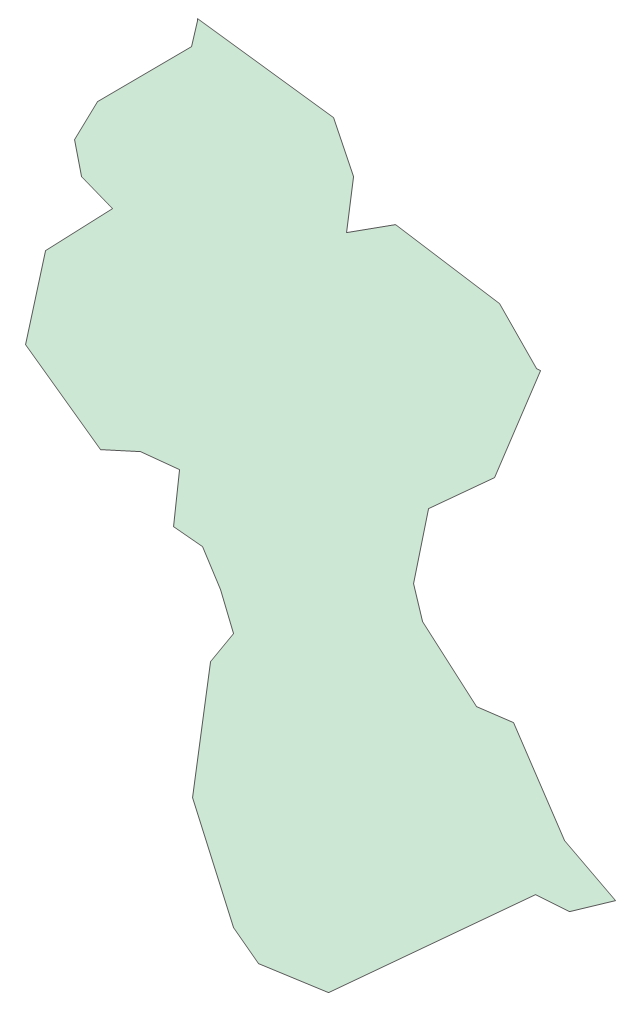
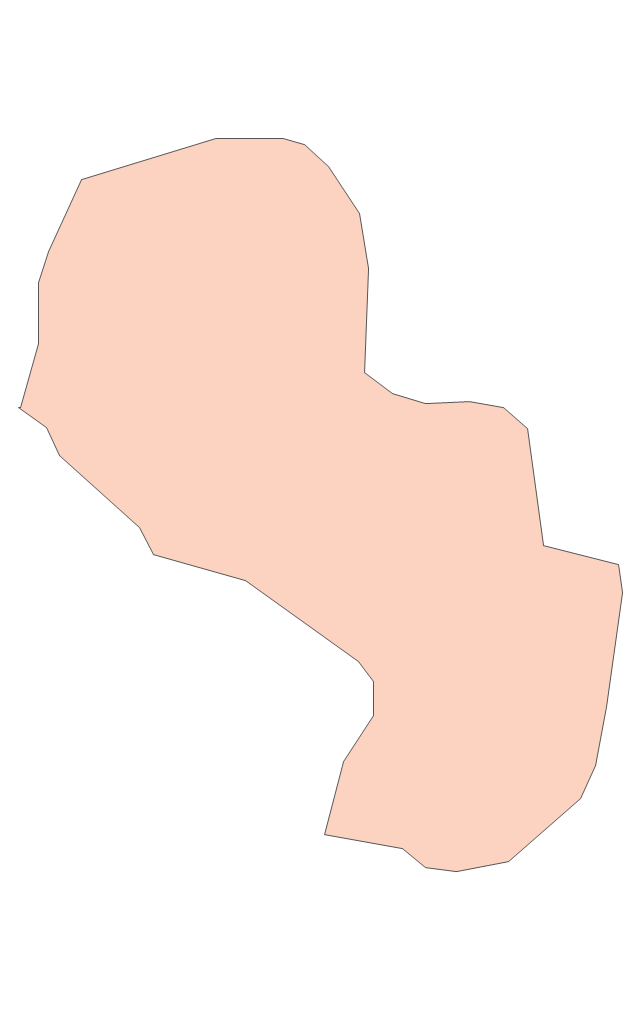
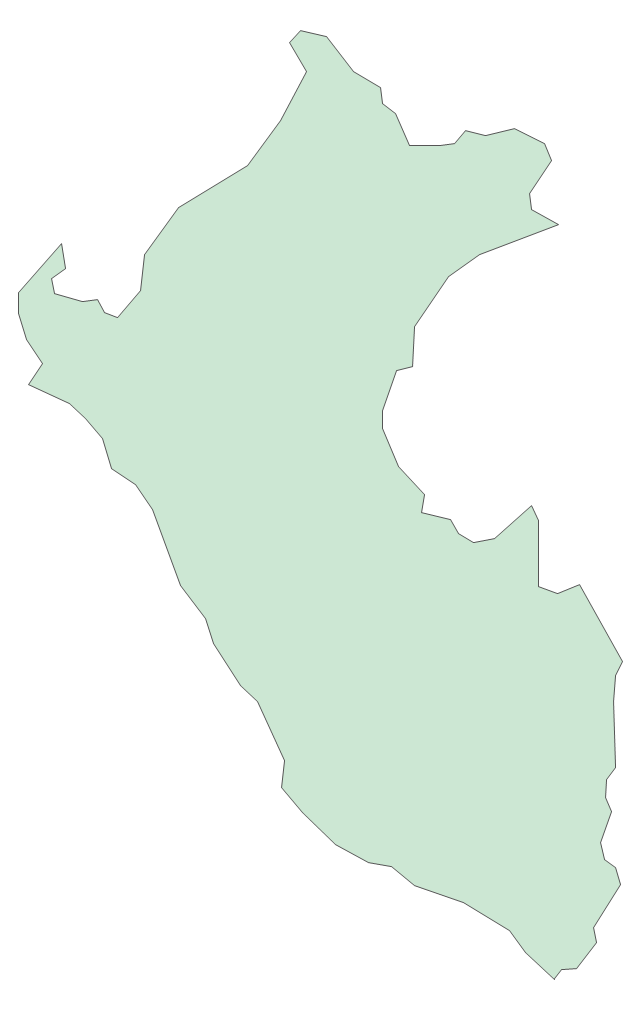
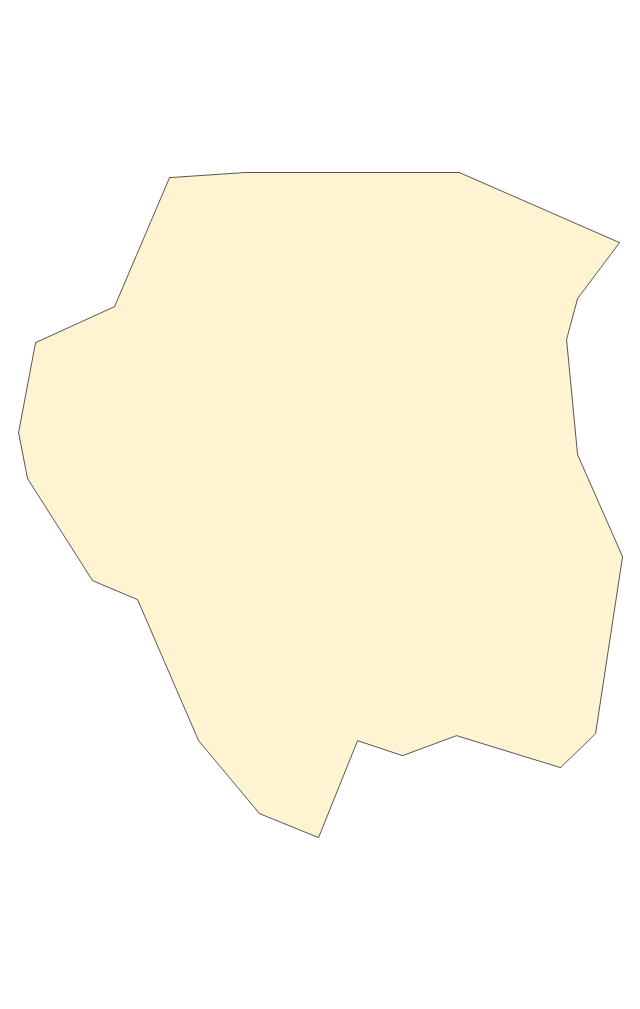
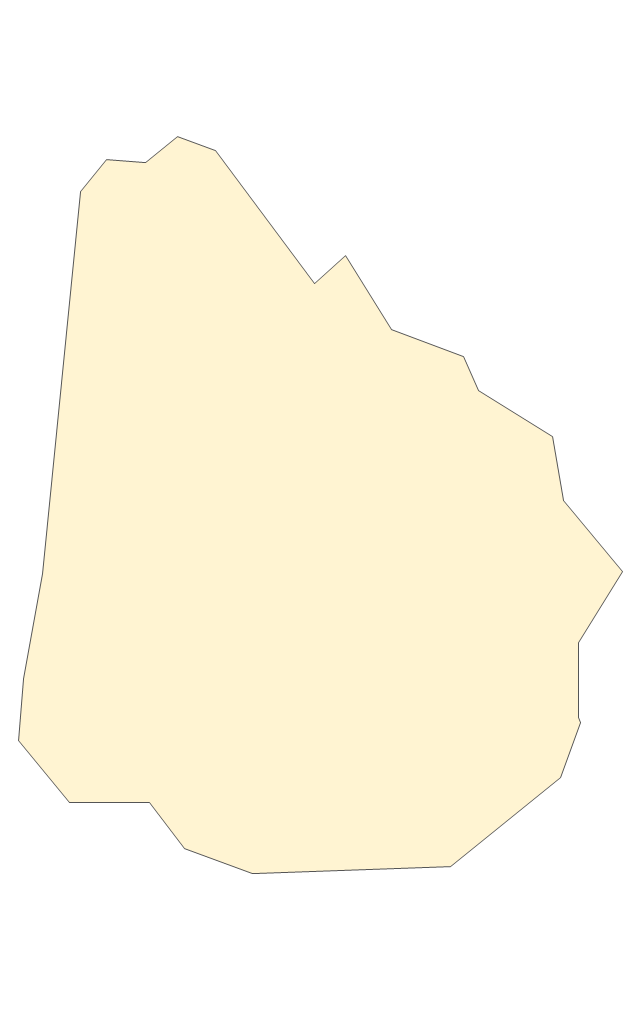
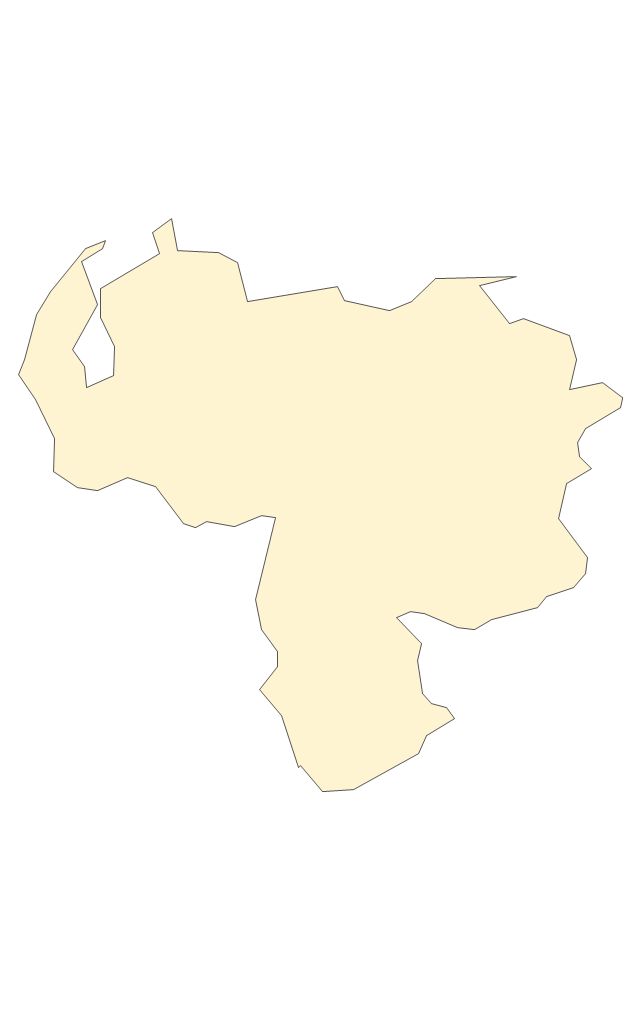
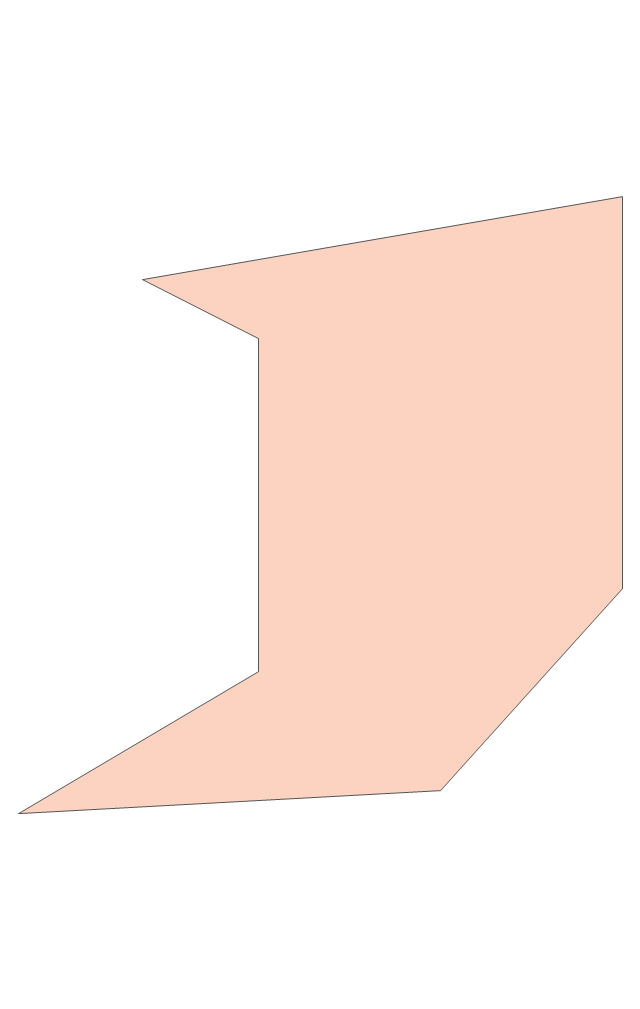
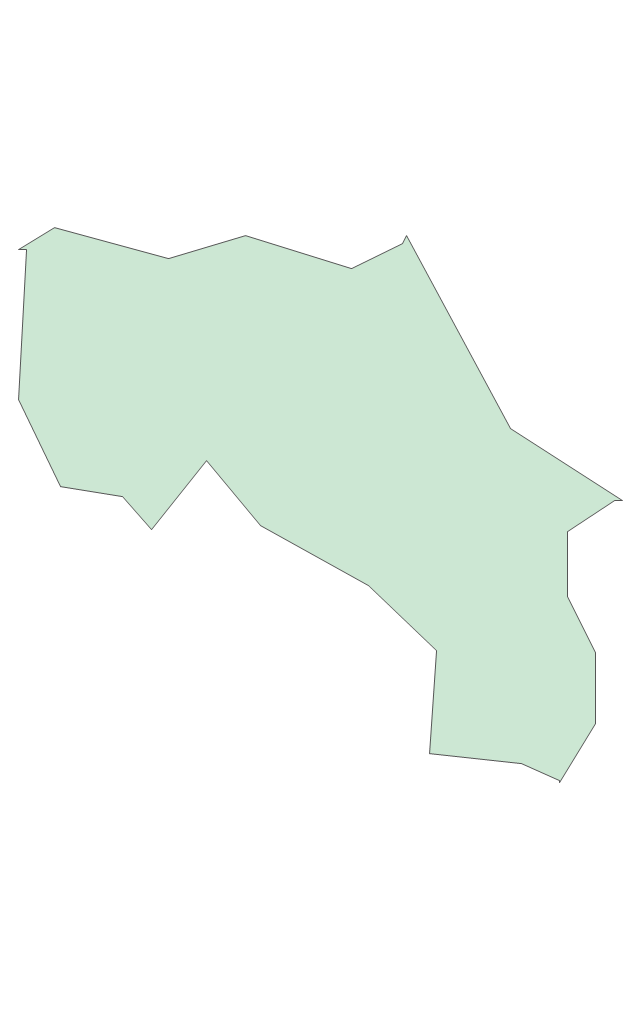
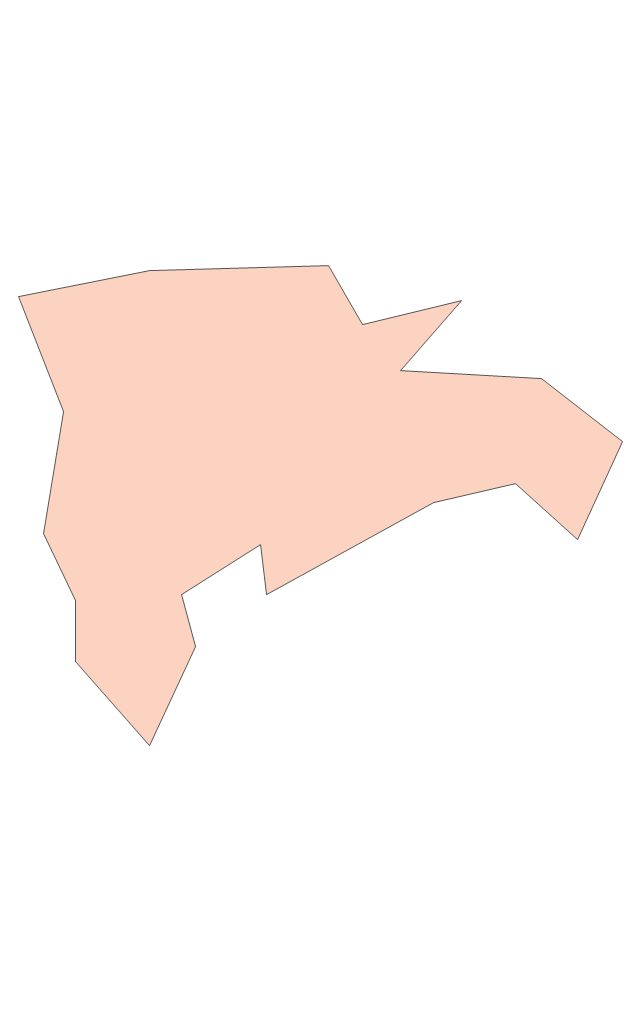
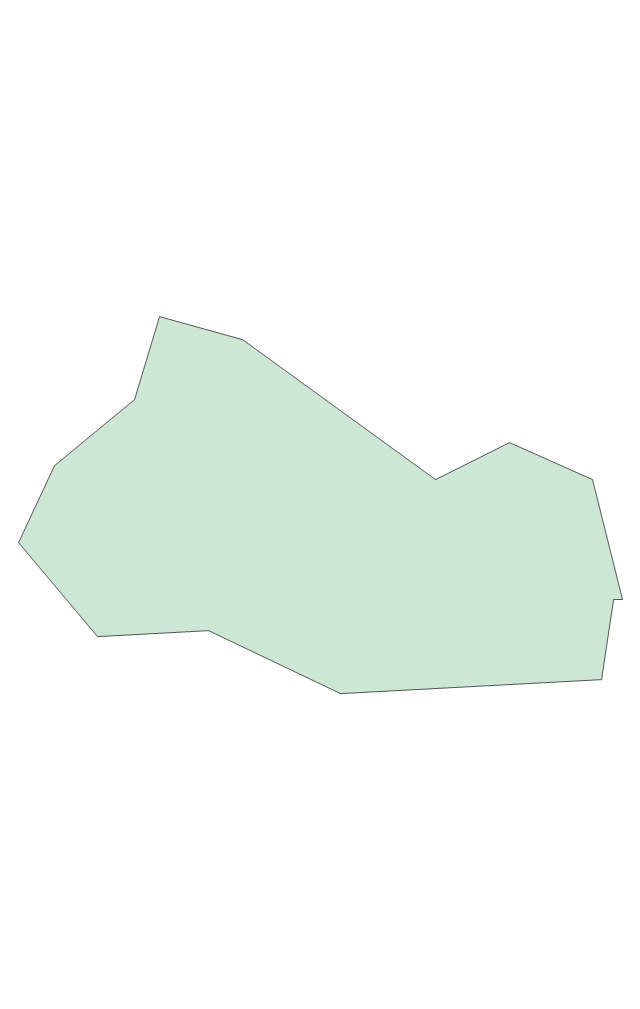
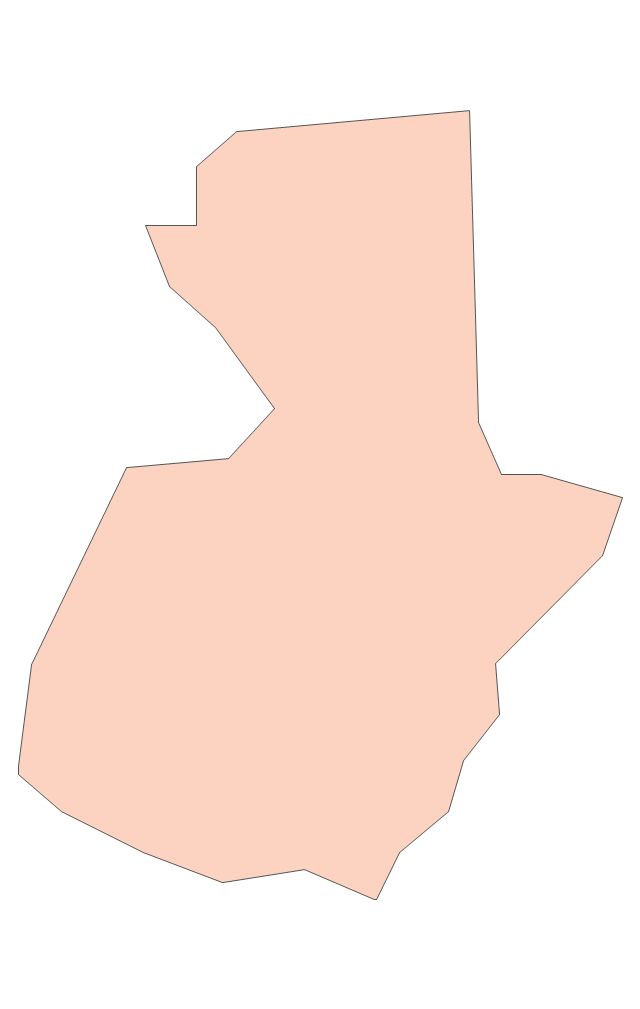
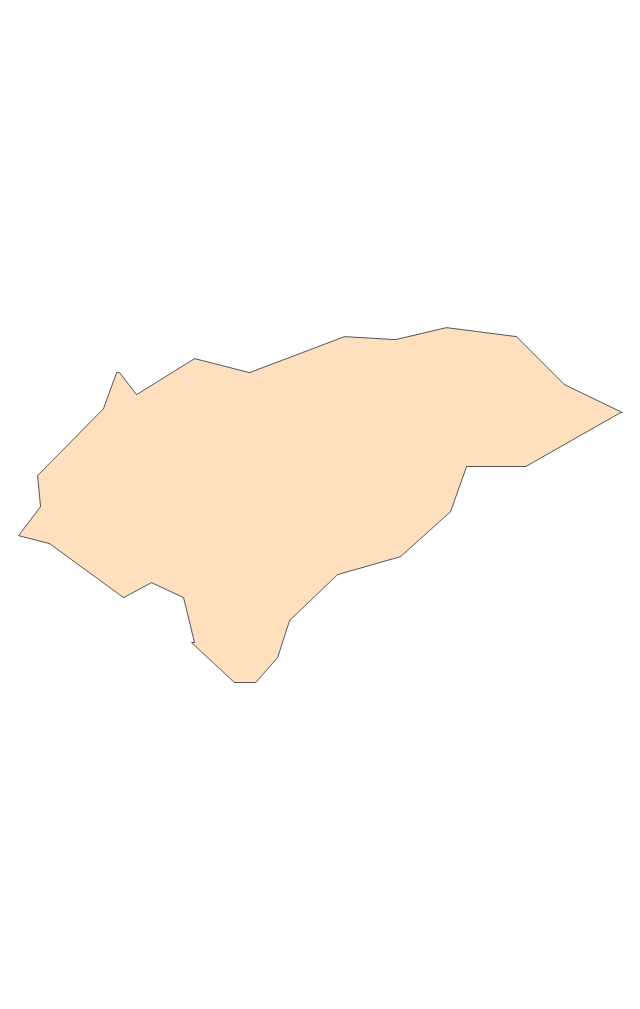
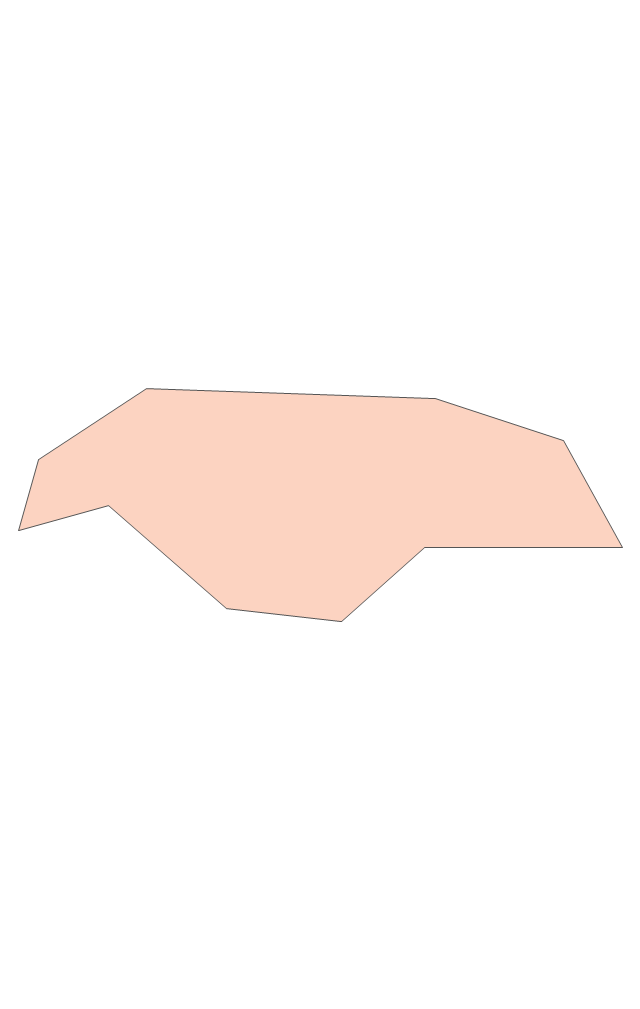
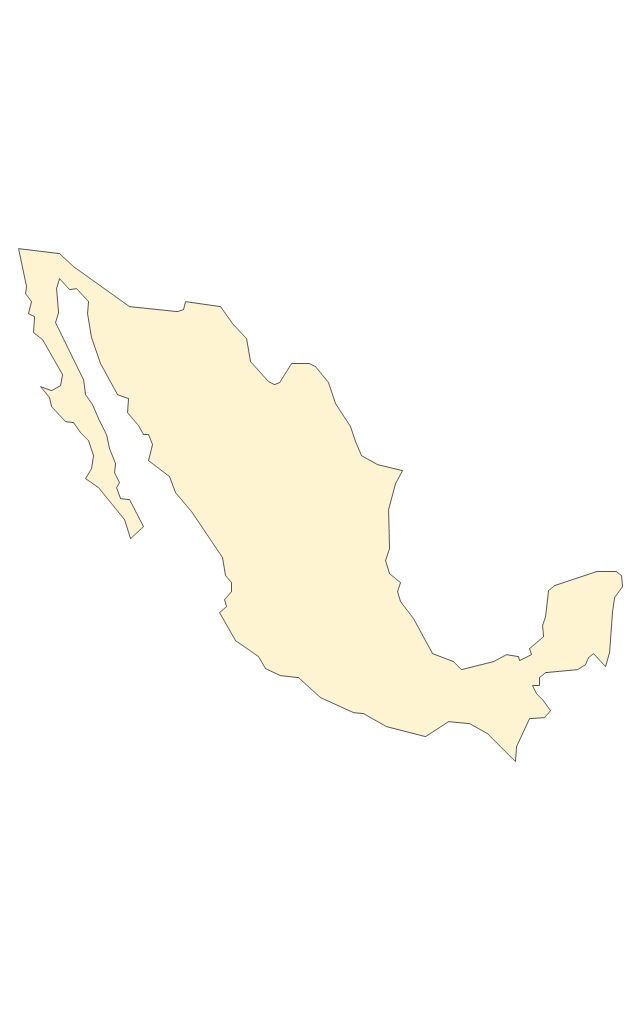
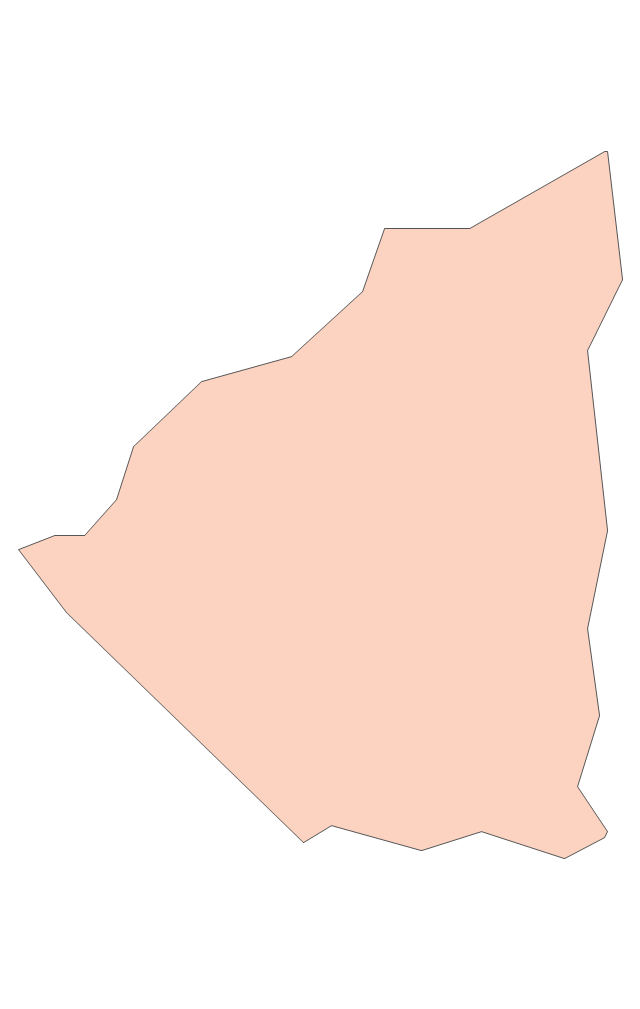
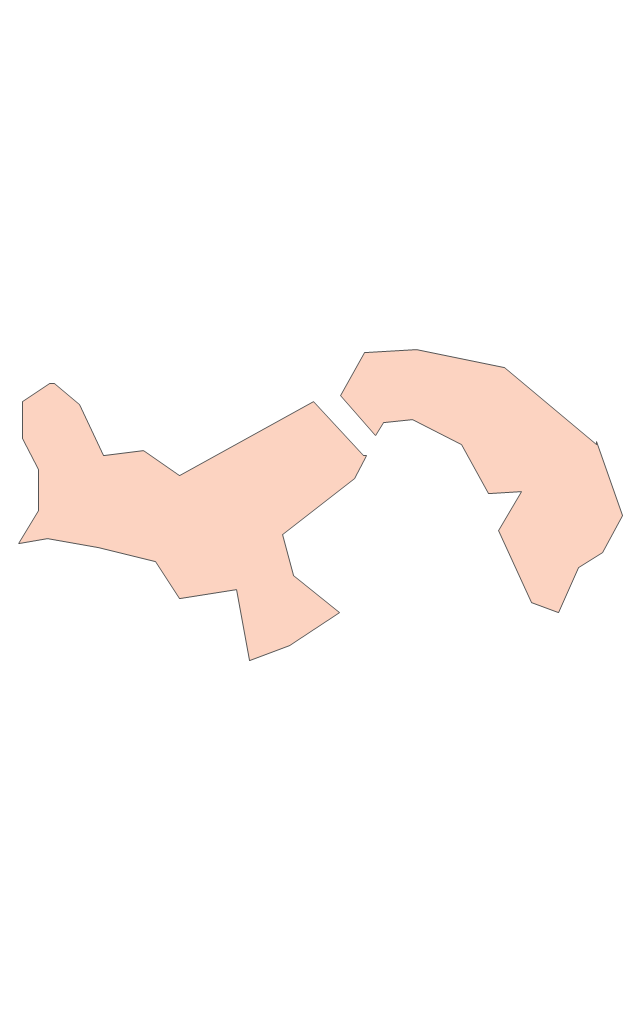
The vector stencils library "South America" contains 29 state map contours for drawing thematic maps of South America. Use it for visual representation of geospatial information, statistics and quantitative data.
"South America is a continent located in the Western Hemisphere, mostly in the Southern Hemisphere, with a relatively small portion in the Northern Hemisphere. ...
It is bordered on the west by the Pacific Ocean and on the north and east by the Atlantic Ocean; North America and the Caribbean Sea lie to the northwest. It includes twelve sovereign states - Argentina, Bolivia, Brazil, Chile, Colombia, Ecuador, Guyana, Paraguay, Peru, Suriname, Uruguay, and Venezuela - and two non-sovereign areas - French Guiana, an overseas department of France, and the Falkland Islands, a British Overseas Territory (nonetheless claimed by Argentina). In addition to this, the ABC islands of the Netherlands may also be considered part of South America." [South America. Wikipedia]
The state map contours example "South America - Vector stencils library" was created using the ConceptDraw PRO diagramming and vector drawing software extended with the Continent Maps solution from the Maps area of ConceptDraw Solution Park.
South America
Central America
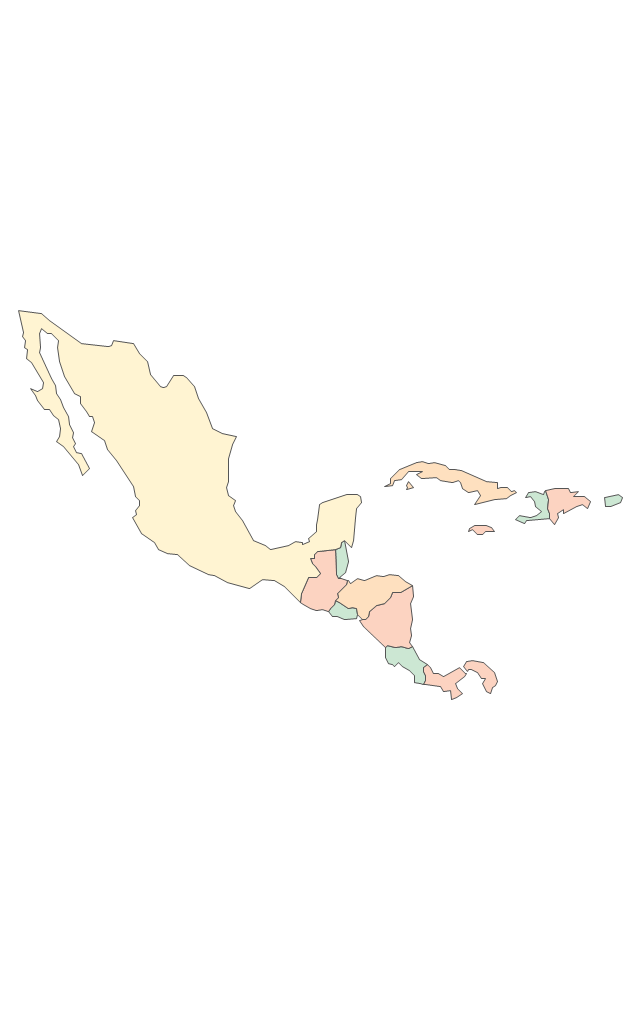
Argentina
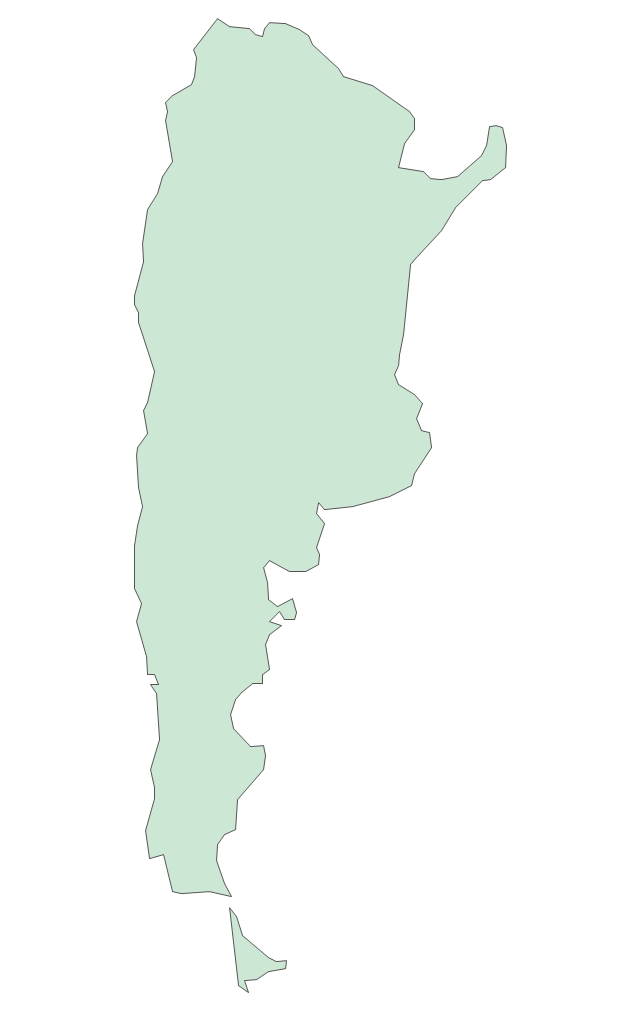
Bolivia
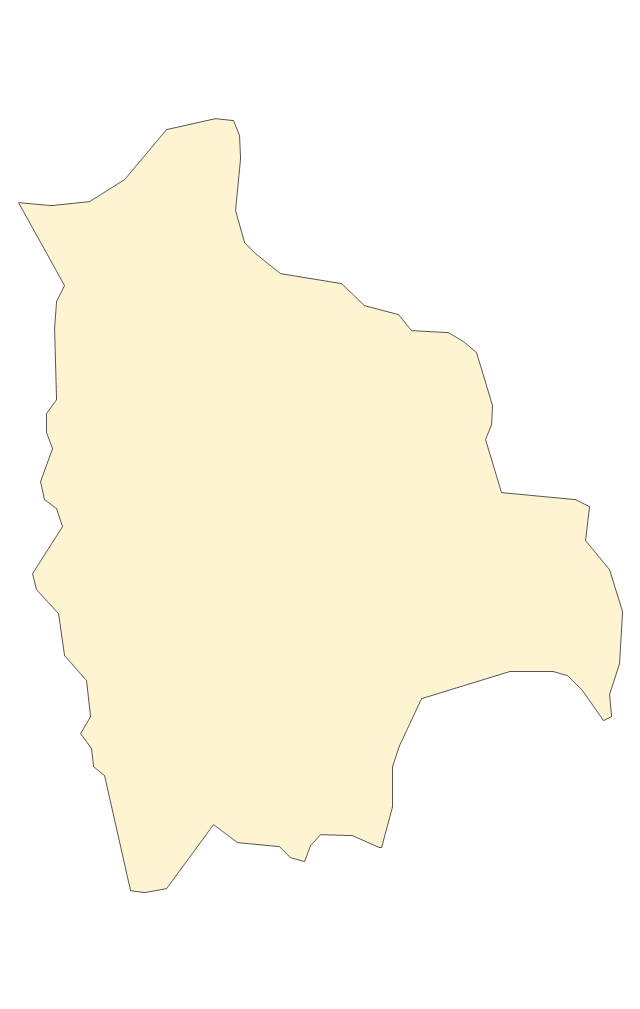
Brazil
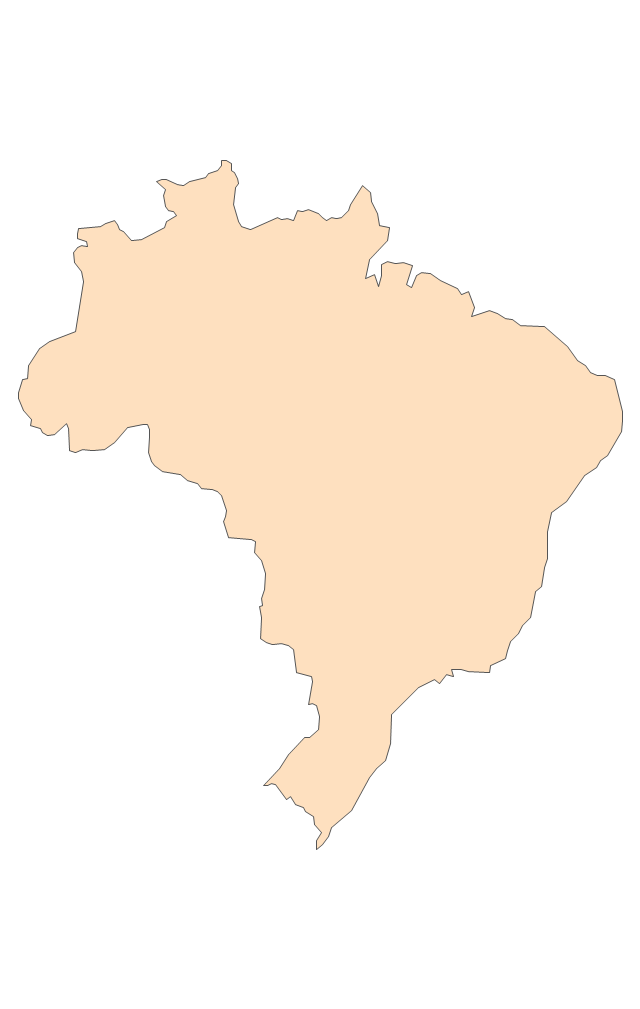
Chile
Colombia
Ecuador
French Guiana
Guyana
Paraguay
Peru
Suriname
Uruguay
Venezuela
Trinidad and Tobago
Belize

Costa Rica
Cuba

Dominican Republic
El Salvador
Guatemala
Haiti

Honduras
Jamaica
Mexico
Nicaragua
Panama
Puerto Rico
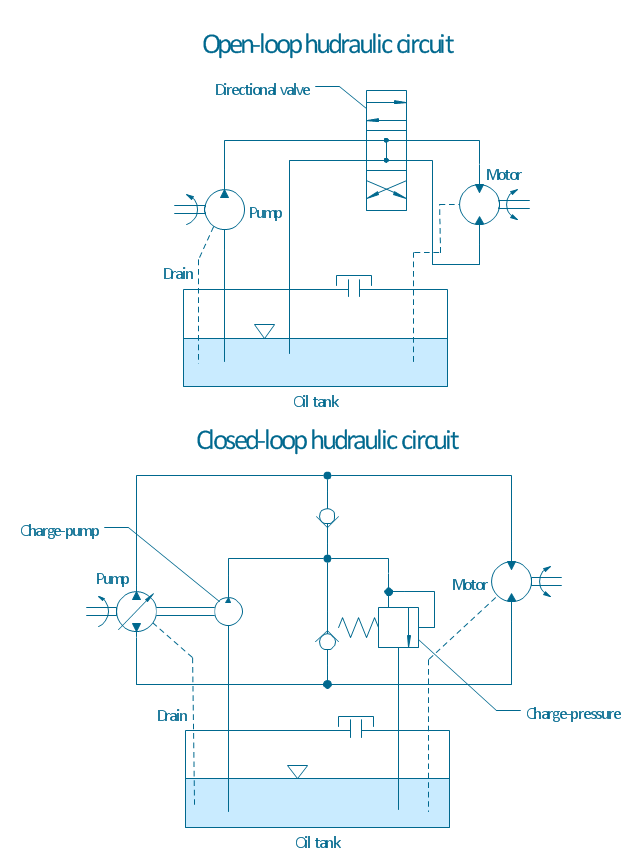
"A hydraulic circuit is a system comprising an interconnected set of discrete components that transport liquid. The purpose of this system may be to control where fluid flows (as in a network of tubes of coolant in a thermodynamic system) or to control fluid pressure (as in hydraulic amplifiers).
... hydraulic circuit theory works best when the elements (passive component such as pipes or transmission lines or active components such as power packs or pumps) are discrete and linear. This usually means that hydraulic circuit analysis works best for long, thin tubes with discrete pumps, as found in chemical process flow systems or microscale devices." [Hydraulic circuit. Wikipedia]
The engineering drawing example "Hydraulic circuits" was redrawn using ConceptDraw PRO diagramming and vector drawing software from the Wikimedia Commons file: Hydraulic circuits.png.
[commons.wikimedia.org/ wiki/ File:Hydraulic_ circuits.png]
This file is licensed under the Creative Commons Attribution-Share Alike 3.0 Unported license.
[creativecommons.org/ licenses/ by-sa/ 3.0/ deed.en]
The engineering drawing example "Hydraulic circuits" is included in the Mechanical Engineering solution from the Engineering area of ConceptDraw Solution Park.
Hydraulic circuit schematic
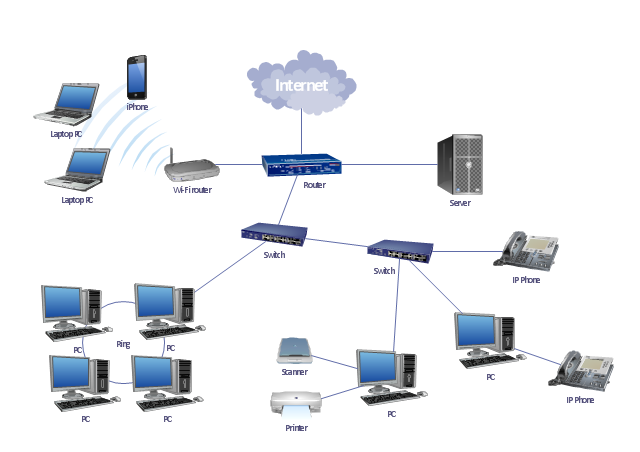
"A local area network (LAN) is a computer network that interconnects computers in a limited area such as a home, school, computer laboratory, or office building using network media. The defining characteristics of LANs, in contrast to wide area networks (WANs), include their smaller geographic area, and non-inclusion of leased telecommunication lines. Ethernet over twisted pair cabling, and Wi-Fi are the two most common technology standards currently used to build LANs." [Local area network. Wikipedia]
This local area network (LAN) topology diargam example was created using the ConceptDraw PRO diagramming and vector drawing software extended with the Computer and Networks solution from the Computer and Networks area of ConceptDraw Solution Park.
This local area network (LAN) topology diargam example was created using the ConceptDraw PRO diagramming and vector drawing software extended with the Computer and Networks solution from the Computer and Networks area of ConceptDraw Solution Park.
LAN topology diagram
The vector stencils library "Management pictograms" contains 72 management pictograms.
Use it to create your management infogram in the ConceptDraw PRO diagramming and vector drawing software.
The flat icons example "Management pictograms - Vector stencils library" is included in the solution "Marketing infographics" from the "Business infographics" area of ConceptDraw Solution Park.
Use it to create your management infogram in the ConceptDraw PRO diagramming and vector drawing software.
The flat icons example "Management pictograms - Vector stencils library" is included in the solution "Marketing infographics" from the "Business infographics" area of ConceptDraw Solution Park.
Accounting management

Activity

Audit management

Board of directors

Budget

Business managemen

Business management tools

Business model

Commanding

Communication

Company

Contract management

Controlling

Coordinating

Core competencies

Corporate strategy

Creativity

Crisis management

Crisis management 2

Decision making

Environmental management

Expenses

External environment

Financial management

Financial management 2

Financial planning

First-level manager

Goal

HR management

Investment management

IT management

Knowledge management

Knowledge management 2

Leadership

Macro environment

Management system

Managerial accounting

Manufacturing management

Market orientation

Marketing management

Marketing strategy

Middle-level manager

Mission

Objectives

Operations management

Organizing

Performance

Performance management

Planning

Policy

PR management

Problem solving

Process management

Product management

Profit

Profit 2

Project management

Quality management

Research and development

Resource management

Resources

Risk management

Sales manegment

Service management

Stakeholder management

Strategic management

Strategic planning

Technology management

Time frame

Time management

Top-level manager

Vision

- How to Create a Picture Graph in ConceptDraw PRO | Network ...
- Pict Tool Example
- HR professions - Vector stencils library | Professions - Vector ...
- Data Flow Diagram Process
- Picture graphs - Vector stencils library | Food - Vector stencils library ...
- Pictures of Graphs | Pictures of Vegetables | Pictures of Food | Pict ...
- Hand Saw Pict Pict
- Pictures of Graphs | Food Pictures | Pictures of Food | Pict Microsoft ...
- Bar Graphs | Sales Growth. Bar Graphs Example | Picture Graphs ...
- Pict Art Sales Person
- Use Appropriate Examples Pictures And Graphs
- Fifa World Cup Pict
- Hand Movements Pict
- Apple Pict
- Pict Topology Wireless Lan Ad Hoc
- Free Pict Time Vector
- Accounting Standard Pict
- Pict Football Field Metric New
- Astronomy Pictures | Astronomy Symbols | Astronomy and Astrology ...
- Fault Tree Analysis Diagrams | PROBLEM ANALYSIS. Root Cause ...