This circle-spoke diagram sample shows the social determinants of health. It was created on the base of the hub-and-spoke diagram from the Health Canada website. [hc-sc.gc.ca/ sr-sr/ pubs/ hpr-rpms/ bull/ 2005-climat/ 2005-climat-6-eng.php]
"Social determinants of health are the economic and social conditions – and their distribution among the population – that influence individual and group differences in health status. They are risk factors found in one's living and working conditions (such as the distribution of income, wealth, influence, and power), rather than individual factors (such as behavioural risk factors or genetics) that influence the risk for a disease, or vulnerability to disease or injury. According to some viewpoints, these distributions of social determinants are shaped by public policies that reflect the influence of prevailing political ideologies of those governing a jurisdiction. ...
In 2003, the World Health Organization (WHO) Europe suggested that the social determinants of health included:
(1) Social gradients (life expectancy is shorter and disease is more common further down the social ladder).
(2) Stress (including stress in the workplace).
(3) Early childhood development.
(4) Social exclusion.
(5) Unemployment.
(6) Social support networks.
(7) Addiction.
(8) Availability of healthy food.
(9) Availability of healthy transportation." [Social determinants of health. Wikipedia]
The hub-and-spoke diagram example "Social determinants of health" was created using the ConceptDraw PRO diagramming and vector drawing software extended with the Circle-Spoke Diagrams solution from the area "What is a Diagram" of ConceptDraw Solution Park.
Circle-spoke diagram

 Business Diagrams
The Business Diagrams Solution extends ConceptDraw DIAGRAM with an extensive collection of professionally designed illustrative samples and a wide variety of vector stencils libraries, which are the real help for all business-related people, business analysts, business managers, business advisers, marketing experts, PR managers, knowledge workers, scientists, and other stakeholders allowing them to design the bright, neat, expressive and attractive Bubble Diagrams, Circle-Spoke Diagrams, Circular Arrows Diagrams, and Venn Diagrams with different quantity of sets in just minutes; and then successfully use them in documents, reports, statistical summaries, and presentations of any style.
Circle Diagrams

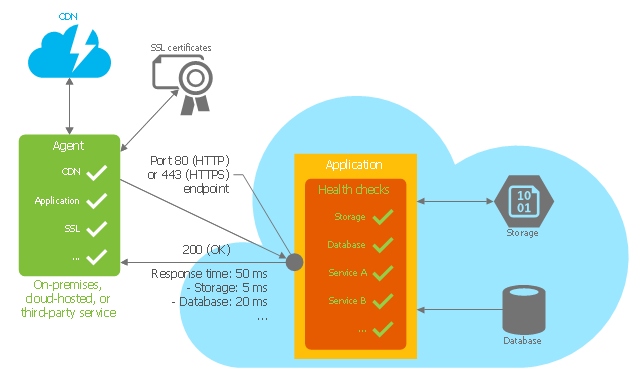
This Azure cloud architecture pattern diagram template was created on the base of figure in the article "Health Endpoint Monitoring Pattern" from the Microsoft Developer Network (MSDN) website.
"Health Endpoint Monitoring Pattern.
Implement functional checks within an application that external tools can access through exposed endpoints at regular intervals. This pattern can help to verify that applications and services are performing correctly. ...
It is good practice—and often a business requirement—to monitor web applications, and middle-tier and shared services, to ensure that they are available and performing correctly. However, it is more difficult to monitor services running in the cloud than it is to monitor on-premises services. ...
Implement health monitoring by sending requests to an endpoint on the application. The application should perform the necessary checks, and return an indication of its status.
A health monitoring check typically combines two factors: the checks (if any) performed by the application or service in response to the request to the health verification endpoint, and analysis of the result by the tool or framework that is performing the health verification check. The response code indicates the status of the application and, optionally, any components or services it uses. The latency or response time check is performed by the monitoring tool or framework." [msdn.microsoft.com/ ru-RU/ library/ dn589789.aspx]
The Azure cloud system architecture diagram template "Health endpoint monitoring pattern" for the ConceptDraw PRO diagramming and vector drawing software is included in the Azure Architecture solutin from the Computer and Networks area of ConceptDraw Solution Park.
Cloud computing system architecture diagram template
3 Circle Venn Diagram. Venn Diagram Example

Circle Spoke Diagram Template

Multi Layer Venn Diagram. Venn Diagram Example

"Chronic care management encompasses the oversight and education activities conducted by health care professionals to help patients with chronic diseases and health conditions such as diabetes, high blood pressure, lupus, multiple sclerosis and sleep apnea learn to understand their condition and live successfully with it. This term is equivalent to disease management (health) for chronic conditions. The work involves motivating patients to persist in necessary therapies and interventions and helping them to achieve an ongoing, reasonable quality of life." [Chronic care management. Wikipedia]
The health care risk diagram (process decision program chart, PDPC) example "Chronic care improvement" was created using the ConceptDraw PRO diagramming and vector drawing software extended with the solution "Seven Management and Planning Tools" from the Management area of ConceptDraw Solution Park.
The health care risk diagram (process decision program chart, PDPC) example "Chronic care improvement" was created using the ConceptDraw PRO diagramming and vector drawing software extended with the solution "Seven Management and Planning Tools" from the Management area of ConceptDraw Solution Park.
Risk diagram
.png--diagram-flowchart-example.png)
What Is a Circle Spoke Diagram

Circles Venn Diagram

- Social determinants of health | Circle-Spoke Diagrams | Circle ...
- Social determinants of health | Flow chart Example. Warehouse ...
- Social determinants of health | Venn Diagram Examples for Problem ...
- Social determinants of health | Process Flowchart | Venn Diagram ...
- Social determinants of health | Circle-spoke diagram - Vector ...
- Social determinants of health | Circle-Spoke Diagrams | Basic Circle ...
- Social determinants of health | Bubble Diagrams | Data Flow ...
- Health Food | Social determinants of health | Health club floor plan ...
- Social determinants of health | CEEBL structure | Circle-Spoke ...
- Social determinants of health | Health Food | How to Create ...