Simple Diagramming
Create flowcharts, org charts, floor plans, business diagrams and more with ConceptDraw PRO.
Presenting Documents with Remote Presentation for Skype Solution
Video tutorials on ConceptDraw products. Try it today!Flow chart Example. Warehouse Flowchart
Warehouse Flowcharts are various diagrams that describe the warehousing and inventory management processes on the warehouses. Typical purposes of Warehouse Flowcharts are evaluating warehouse performance, measuring efficiency of customer service and organizational performance. This type of Workflow diagrams can be used for identifying any disconnection between business activities and business objectives. They are effectively used by warehouse-related people and organizations, manufacturers, wholesalers, exporters, importers, transporters, and others. Standard Warehousing process flow diagram and standard Workflow diagram are used for process identification for further evaluating effectiveness and profitability of overall business process. Use the ConceptDraw PRO vector graphic software extended with Flowcharts solution to design your own professional-looking Workflow diagrams and Flowcharts of any types, including the Warehouse flowchart, Process flow diagrams which depict in details all steps of Warehouse packages flow. Microsoft Visio, designed for Windows users, can’t be opened directly on Mac. But fortunately, there are several Visio alternatives for Mac which will help Mac users to work Visio files. With ConceptDraw PRO, you may open, edit and save files in Visio format.
The Sales Process
The Sales Process is a complex approach for selling a product or service which assumes many steps including the sales planning, realization of the sales marketing and management strategies, sales process analysis, etc. Now we have a ConceptDraw PRO software extended with unique Sales Flowcharts solution from the Marketing area of ConceptDraw Solution Park which ideally suits for the planning and realization the company's sales process.Design Pictorial Infographics. Design Infographics
In the course of recent decades data visualization went through significant development and has become an indispensable tool of journalism, business intelligence and science. The way visual information may be conveyed is not limited simply to static or dynamic representation, it can also be interactive. Infographics can be conditionally divided into several general levels. Primarily, this is level of visualization of information, its interpretation and association on any ground. Second level can be defined as a visualization of knowledge, depiction of thoughts and ideas in the form of images or diagrams. Finally, the level of data visualization, which processes data arrays in charts, enabling the information to be more clearly perceived. You can also identify the main approaches to the creation of infographics: exploratory and narrative. Exploratory method insists on minimalist design in favor of data precision without unnecessary details and is common for scientific researches and anaOnline Marketing Objectives
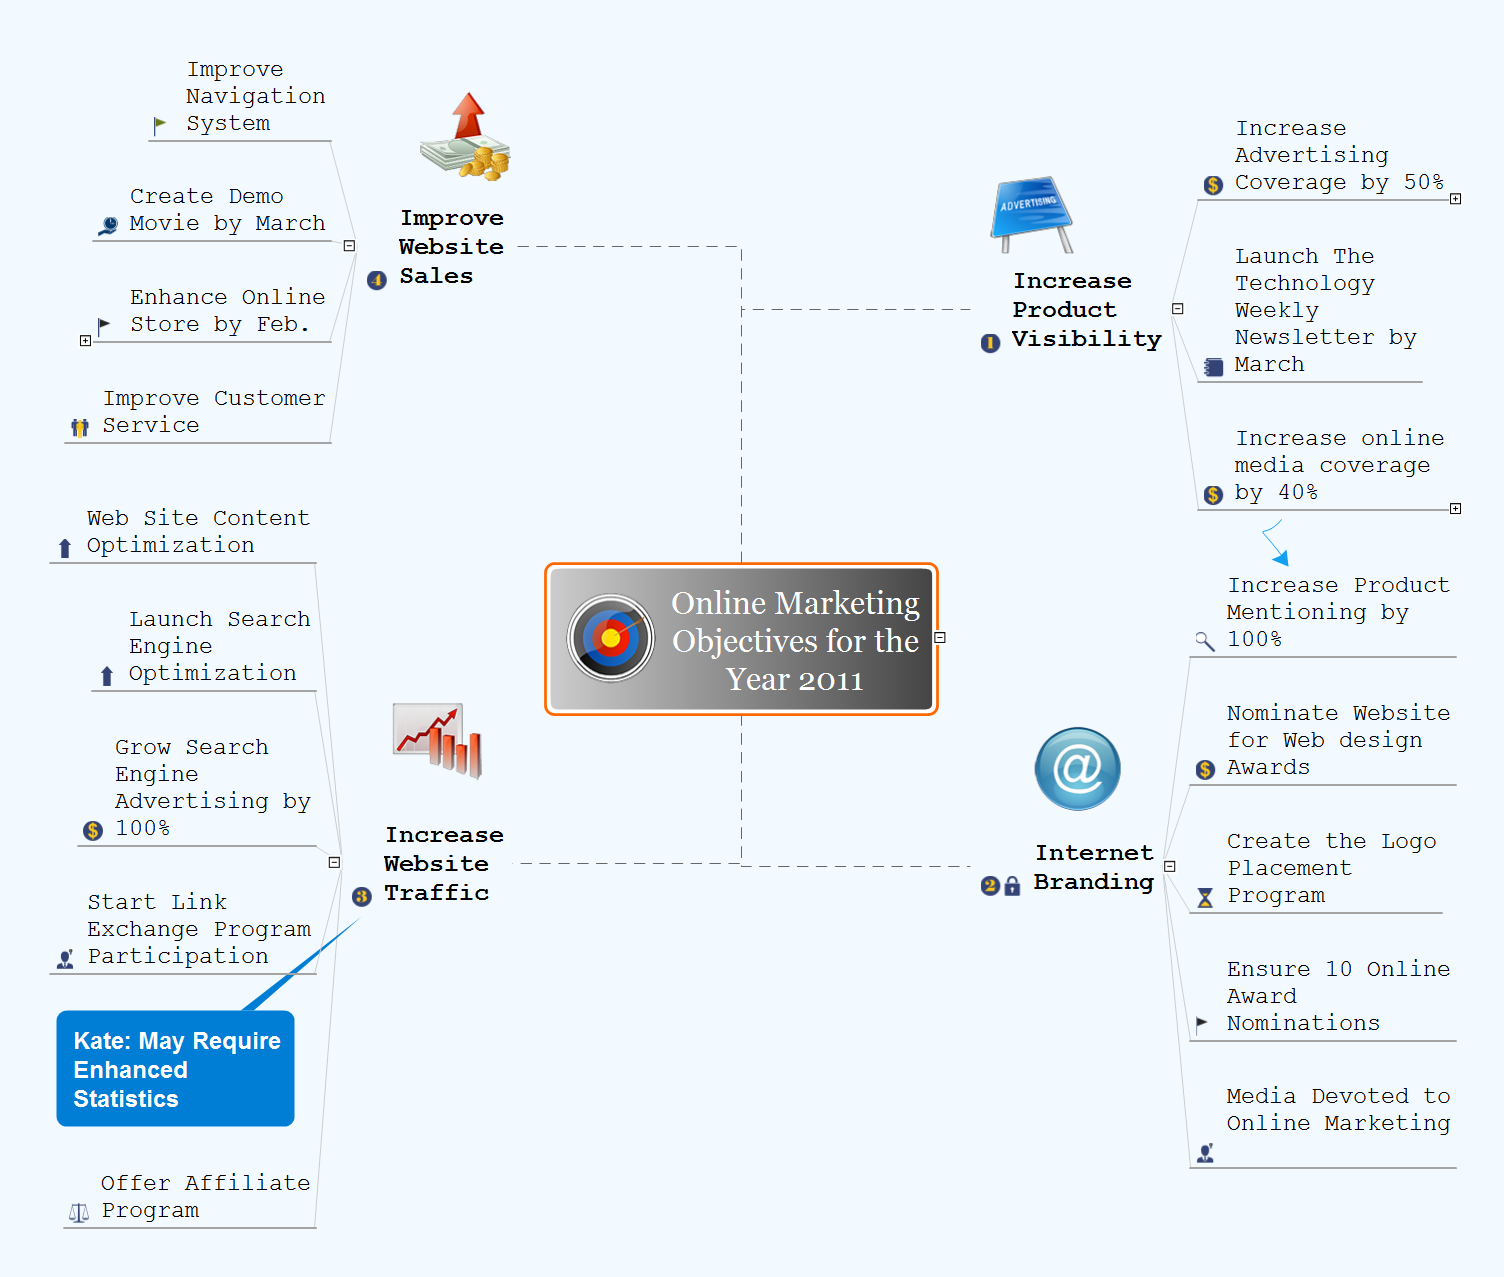
Promotion and sale of goods or services, as well as the conquest of free niche on the market in a given category include numerous methods directed on the advertising the products and attraction attention of potential buyers. Among them are traditional methods of struggle for the buyer, as well as internet marketing or online marketing, that is a complex of measures aimed at attraction of clients using the online technologies. The main tool of online marketing is a website of the company. The proper preparation and promotion of website ensure to the owner the opportunity to successfully compete with manufacturers of similar products, ensuring the high sales. Today each manufacturer, regardless of the size and direction of activities, creates a website, online store, blog, pages in social networks that give the visitors full information about the company, its products and services. Given the fact that a potential buyer spends a lot of time at the Internet, such strategy is justified and the practice shows a high efficiency of online marketing. ConceptDraw MINDMAP helps to illustrate a value of outline marketing on a Mind Map, to represent the online marketing objectives for a company and to specify the targets outlined for each of these objectives.
 Fishbone Diagrams
The Fishbone Diagrams solution extends ConceptDraw PRO v10 software with the ability to easily draw the Fishbone Diagrams (Ishikawa Diagrams) to clearly see the cause and effect analysis and also problem solving. The vector graphic diagrams produced using this solution can be used in whitepapers, presentations, datasheets, posters, and published technical material.
 Entity-Relationship Diagram (ERD)
Entity-Relationship Diagram (ERD) solution extends ConceptDraw PRO software with templates, samples and libraries of vector stencils from drawing the ER-diagrams by Chen's and crow’s foot notations.
What Is a Concept Map
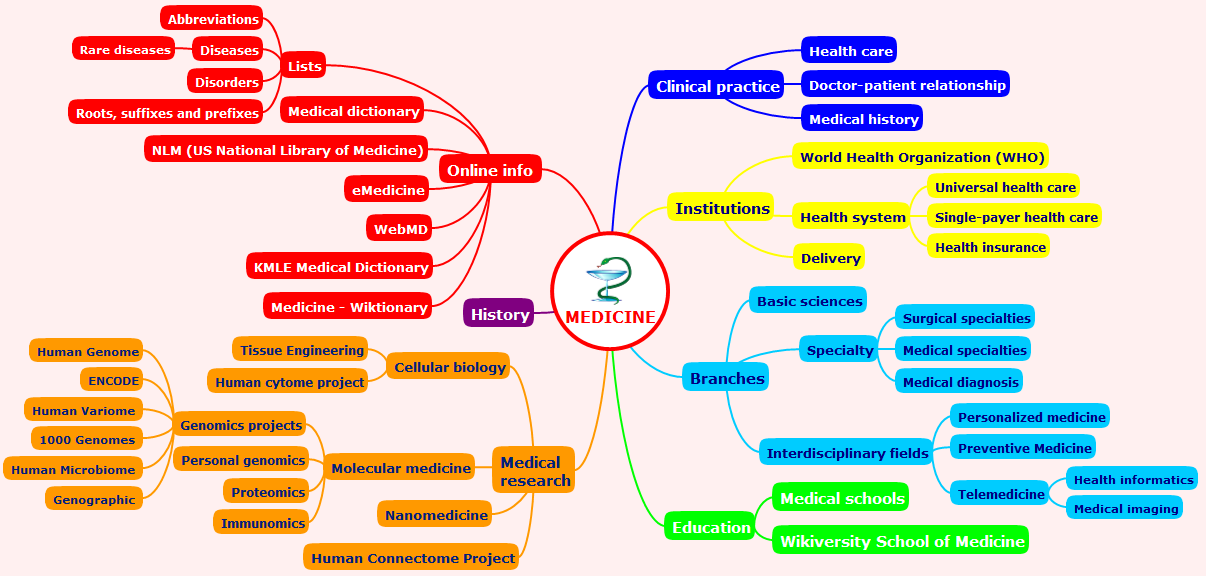
What is a Concept Map and what software is effective for its design? A concept map or conceptual diagram is a diagram that depicts suggested relationships between concepts. As for effective software - we suggest you to pay attention for the ConceptDraw PRO diagramming and vector drawing software. Extended with Concept Maps Solution from the "Diagrams" Area it is a real godsend for you.
 Business and Finance
Use Business and Finance solution to make professional-looking documents, presentations and websites, business, finance, advertising, and project management illustrations, or any designs that requires clipart of currency, office, business, advertising, management, marketing, people, time, post, contacts, collaboration, etc.
Marketing - Design Elements
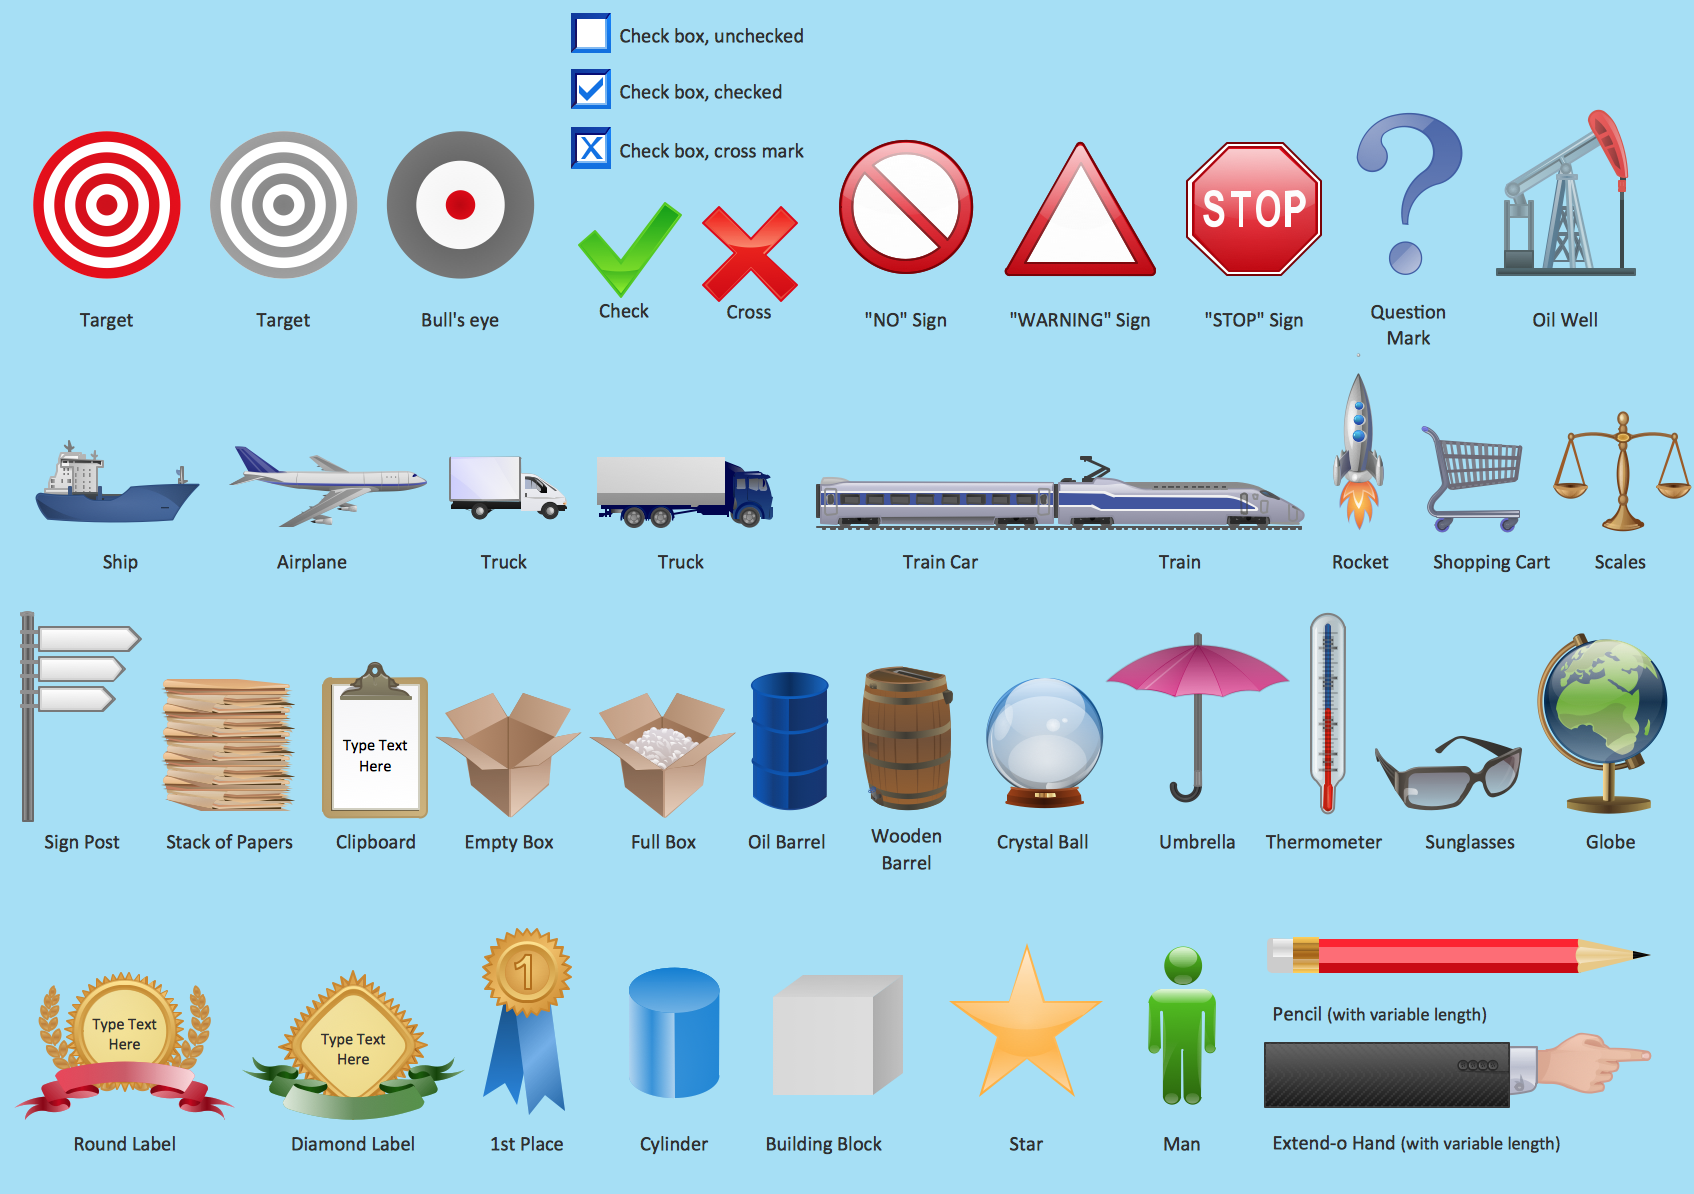
If you need to pull together a quick marketing drawing, you'll find elements, samples, templates and libraries with vector clip art for drawing the Marketing Illustrations. These symbols and signs you can use in your design for Strategic Marketing, Graphic Design, Inbound and Content Marketing, Social Media, Lead Generation, Email Marketing and Automation, CRM implementation and Integration and more. This symbols used for marketing presentation, project management report, project management tracking tools and other types of creative project management software.Positive Influencer Feedback
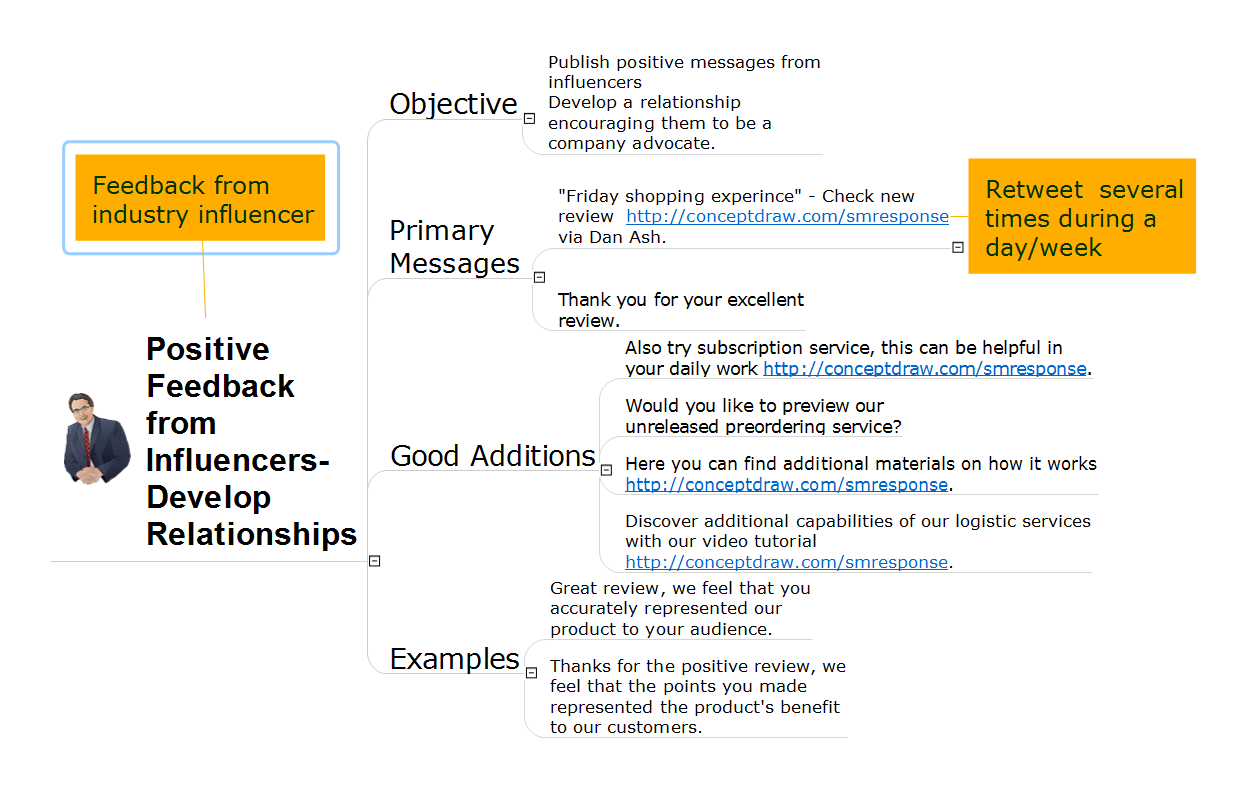
Reviews and feedback have great importance in the sphere of business promotion and help to establish the profitable relationships. They are one of the most effective marketing tools that contribute to increasing sales. Unfortunately, many entrepreneurs in their work often miss the importance of this moment. However the reading and processing of comments and feedback of customers and influencers, and recording the interesting ideas that they include, is very important for any business. No matter what they contain - complaints or praise, but this information cannot be ignored. If previously the gathering of feedback about the product was a very long and laborious process, demanding a lot of time, effort and patience, now all is much easier. Today, in the age of digital technologies, are widespread the reviews on company websites and various social networks. This action Mind Map designed in ConceptDraw MINDMAP software helps to correctly respond to positive feedback from the well-known or industry influencers. The represented ready response phrases can be used for quick composing and tweeting/posting response messages.
 Block Diagrams
Block diagrams solution extends ConceptDraw PRO software with templates, samples and libraries of vector stencils for drawing the block diagrams.
- Concept Maps | How To Create a Concept Map in Visio Using ...
- Download Quality Image Of Activity Diagram For Online Shopping
- Concept Maps | How To Make a Concept Map | What Is a Concept ...
- Online shop - Concept map
- Marketing - Vector stencils library | Internet marketing - Concept map ...
- Concept Maps | Value Stream Mapping | How to Add a Concept Map ...
- Marketing - Vector stencils library | Societal Marketing Concept ...
- Simple Diagramming | ConceptDraw Solution Park | Concept Maps ...
- Conceptdraw.com: Mind Map Software, Drawing Tools | Project ...
- Concept Maps | How To Make a Concept Map | Concept Maps ...
- Concept Maps | Concepts and relationship in the geopolitical ...
- Internet marketing - Concept map
- Internet marketing - Concept map | Concept Maps | What Is a ...
- Simple Diagramming | Concept Map | Concept Maps | Business ...
- Simple Diagramming | Concept Map | How to Create a PowerPoint ...
- Internet marketing - Concept map | What Is a Concept Map ...
- Images Of Entitity Relationship Diag In Online Business Directory
- Online shop - Concept map | Simple Diagramming | Concept Map ...
- Concept Mapping Examples
- Sales Process Map | ConceptDraw Solution Park | Sales symbols ...


