This exploded pie chart sample shows the economic sector weightings. It was designed on the base of the Wikimedia Commons file: Badpie.png [commons.wikimedia.org/ wiki/ File:Badpie.png].
This image is available under the Creative Commons Attribution-ShareAlike 3.0 Unported License [creativecommons.org/ licenses/ by-sa/ 3.0/ ].
"The classical breakdown of all economic sectors follows:
Primary: Involves the retrieval and production of raw materials, such as corn, coal, wood and iron. (A coal miner and a fisherman would be workers in the primary sector.)
Secondary: Involves the transformation of raw or intermediate materials into goods e.g. manufacturing steel into cars, or textiles into clothing. (A builder and a dressmaker would be workers in the secondary sector.)
Tertiary: Involves the supplying of services to consumers and businesses, such as baby-sitting, cinema and banking. (A shopkeeper and an accountant would be workers in the tertiary sector.)
In the 20th century, it began to be argued that traditional tertiary services could be further distinguished from "quaternary" and quinary service sectors." [Economic sector. Wikipedia]
The exploded pie chart example "Economic sector weightings" was created using the ConceptDraw PRO diagramming and vector drawing software extended with the Pie Charts solution of the Graphs and Charts area in ConceptDraw Solution Park.
Exploded pie chart

The vector stencils library "AWS On-Demand Workforce" contains 5 Amazon Web Services on-demand workforce icons: Amazon Mechanical Turk, Human Intelligence Tasks (HIT), Assignment/ Task, Workers, Requester.
Use it to draw Amazon Web Services architecture diagrams with ConceptDraw PRO diagramming and vector drawing software.
"Amazon Mechanical Turk (MTurk) is a crowdsourcing Internet marketplace enabling individuals and businesses (known as Requesters) to coordinate the use of human intelligence to perform tasks that computers are currently unable to do. It is one of the sites of Amazon Web Services. Employers are able to post jobs known as Human Intelligence Tasks (HITs), such as choosing the best among several photographs of a storefront, writing product descriptions, or identifying performers on music CDs. Workers (called Providers in Mechanical Turk's Terms of Service, or, more colloquially, Turkers) can then browse among existing jobs and complete them in exchange for a monetary payment set by the employer. To place jobs, the requesting programs use an open application programming interface (API), or the more limited MTurk Requester site." [Amazon Mechanical Turk. Wikipedia]
The AWS icons example "Design elements - AWS On-Demand Workforce" is included in the AWS Architecture Diagrams solution from the Computer and Networks area of ConceptDraw Solution Park.
Amazon Web Services icons
Types of Flowcharts


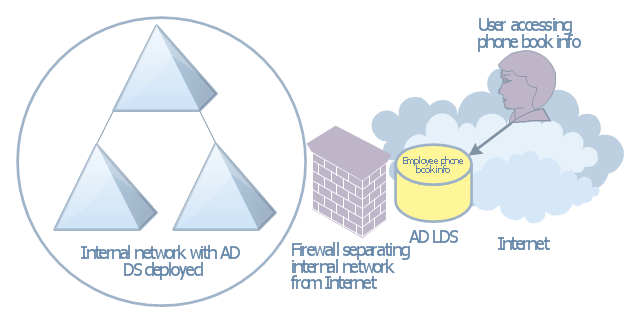
This AD diagram example was created based on the picture "AD LDS as a phone book service" from the book "Active Directory for Dummies".
"Directory services are a great way of providing information that can be fre-
quently retrieved and searched on in a hierarchical way. ... Well, there’s no reason that you can’t create a directory service that’s actually a phone book. Imagine that you need to make a searchable phone directory of your organization available on the Internet. ... This isn’t a difficult task, but it has security repercussions. If you’ve already deployed AD DS and you have the employees’ phone numbers available in that directory, it might not be a good idea to expose your AD DS environment to the Internet for security reasons. Using AD LDS is a great alternative because it can be deployed separately from AD DS and it’s designed to simply provide the information retrieval service that you need without the complications involved with Kerberos authentication and group policies." [Steve Clines and Marcia Loughry, Active Directory® For Dummies®, 2nd Edition. 2008]
The Active Directory diagram example "AD LDS as a phone book service" was created using the ConceptDraw PRO diagramming and vector drawing software extended with the Active Directory Diagrams solution from the Computer and Networks area of ConceptDraw Solution Park.
Active Directory network diagram
HR Management Software

This ring chart sample was redesigned from the Wikipedia file: Virtuous circle in management.svg.
"An example of the use of a virtuous circle in management."
[en.wikipedia.org/ wiki/ File:Virtuous_ circle_ in_ management.svg]
"A virtuous circle and a vicious circle (also referred to as virtuous cycle and vicious cycle) are economic terms. They refer to a complex chain of events that reinforces itself through a feedback loop. A virtuous circle has favorable results, while a vicious circle has detrimental results.
Both circles are complexes of events with no tendency towards equilibrium (at least in the short run). Both systems of events have feedback loops in which each iteration of the cycle reinforces the previous one (positive feedback). These cycles will continue in the direction of their momentum until an external factor intervenes and breaks the cycle. The prefix "hyper-" is sometimes used to describe these cycles if they are extreme. The best-known example of a vicious circle is hyperinflation. ...
Example in management.
Virtuous circle.
An employer's investment in his employees’ ability to provide superior service to customers can be seen as a virtuous circle. Effort spent in selecting and training employees and creating a corporate culture in which they are empowered can lead to increased employee satisfaction and employee competence. This can result in superior service delivery and customer satisfaction. This in turn will create customer loyalty, improved sales levels, and higher profit margins. Some of these profits can be reinvested in employee development, thereby initiating another iteration of a virtuous cycle." [en.wikipedia.org/ wiki/ Virtuous_ circle_ and_ vicious_ circle]
The ring chart example "Virtuous circle (management)" was created using the ConceptDraw PRO diagramming and vector drawing software extended with the Target and Circular Diagrams solution from the Marketing area of ConceptDraw Solution Park.
www.conceptdraw.com/ solution-park/ marketing-target-and-circular-diagrams
Ring chart
---ring-chart.png--diagram-flowchart-example.png)
Basic Flowchart Symbols and Meaning


Bank Customer Positive Feedback

The vector stencils library "AWS Application Services" contains 12 AWS application services icons: Amazon CloudSearch, SDF metadata, Amazon SES, Email, Amazon AppStream, Amazon SQS, Queue, Message, Amazon SWF, Decider, Worker, Elastic Transcoder. Use it to draw Amazon Web Services architecture diagrams of your cloud service. The symbols example "AWS Application Services - Vector stencils library" was created using the ConceptDraw PRO diagramming and vector drawing software extended with the AWS Architecture Diagrams solution from the Computer and Networks area of ConceptDraw Solution Park.
Amazon CloudSearch

SDF metadata

Amazon SES

Email

Amazon AppStream

Amazon SQS

Queue

Message

Amazon SWF

Decider

Worker

Elastic Transcoder

Process Flowchart


 Fishbone Diagrams
The Fishbone Diagrams solution extends ConceptDraw PRO v10 software with the ability to easily draw the Fishbone Diagrams (Ishikawa Diagrams) to clearly see the cause and effect analysis and also problem solving. The vector graphic diagrams produced using this solution can be used in whitepapers, presentations, datasheets, posters, and published technical material.
HelpDesk
Download and Install a Solution from ConceptDraw Solution Park

- Workers
- Amazon Web Service Workflow
- Economic sector weightings | Bar Diagrams for Problem Solving ...
- Economic sector weightings | Room Planning Software | Porter's ...
- Examples of Flowcharts, Org Charts and More | Copying Service ...
- Process Flowchart | Workflow Diagram Software | Taxi service ...
- AWS Application Services - Vector stencils library | Design elements ...
- Diagramming software for Amazon Web Service diagrams, charts ...
- Cisco Intelligent Services Gateway
- Design elements - AWS Application Services | AWS Application ...
- AWS simple icons - Vector stencils library | Awsami
- AWS icons 2.0 | Diagramming software for Amazon Web Service ...
- Design elements - AWS Groups | Diagramming software for Amazon ...
- Hotel Plan. Hotel Plan Examples | Copying Service Process ...
- Social Workers Work Flow Analysis Chart
- Quality function deployment chart - Handheld projector | Quality ...
- UML communication diagram - Client server access | Campus Area ...
- How to Draw an Organization Chart | Organizational Structure ...
- Organizational Structure | Organizational Structure | Active Directory ...
- Organizational Structure | Flow chart Example. Warehouse ...