This exploded pie chart sample shows the economic sector weightings. It was designed on the base of the Wikimedia Commons file: Badpie.png [commons.wikimedia.org/ wiki/ File:Badpie.png].
This image is available under the Creative Commons Attribution-ShareAlike 3.0 Unported License [creativecommons.org/ licenses/ by-sa/ 3.0/ ].
"The classical breakdown of all economic sectors follows:
Primary: Involves the retrieval and production of raw materials, such as corn, coal, wood and iron. (A coal miner and a fisherman would be workers in the primary sector.)
Secondary: Involves the transformation of raw or intermediate materials into goods e.g. manufacturing steel into cars, or textiles into clothing. (A builder and a dressmaker would be workers in the secondary sector.)
Tertiary: Involves the supplying of services to consumers and businesses, such as baby-sitting, cinema and banking. (A shopkeeper and an accountant would be workers in the tertiary sector.)
In the 20th century, it began to be argued that traditional tertiary services could be further distinguished from "quaternary" and quinary service sectors." [Economic sector. Wikipedia]
The exploded pie chart example "Economic sector weightings" was created using the ConceptDraw PRO diagramming and vector drawing software extended with the Pie Charts solution of the Graphs and Charts area in ConceptDraw Solution Park.
Exploded pie chart

Room Planning Software

"A value chain is a chain of activities that a firm operating in a specific industry performs in order to deliver a valuable product or service for the market. ...
The concept of value chains as decision support tools, was added onto the competitive strategies paradigm developed by Porter as early as 1979. In Porter's value chains, Inbound Logistics, Operations, Outbound Logistics, Marketing and Sales and Service are categorized as primary activities. Secondary activities include Procurement, Human Resource management, Technological Development and Infrastructure." [Value chain. Wikipedia]
This Porter's value chain matrix diagram example was created using the ConceptDraw PRO diagramming and vector drawing software extended with the Matrices solution from the Marketing area of ConceptDraw Solution Park.
Porter's value chain matrix

Ring Network Topology

How to draw Metro Map style infographics? (New York)

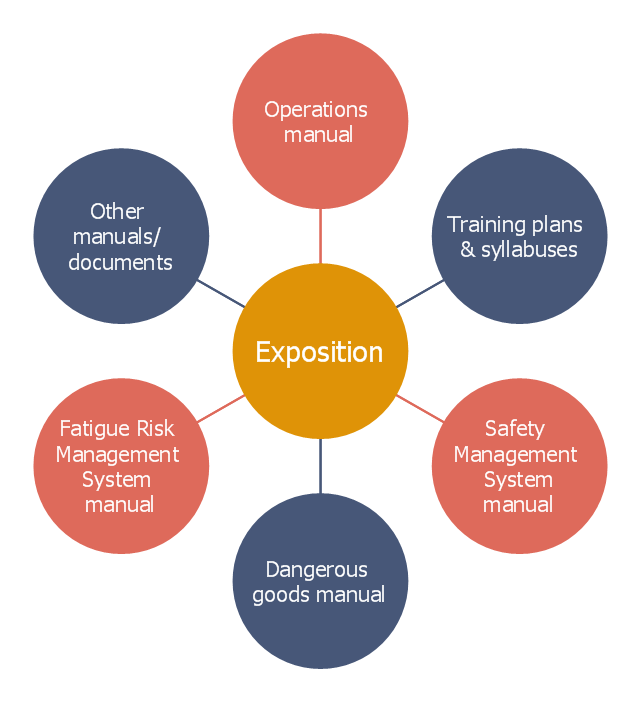
This circle-spoke diagram example was crated on the base of the illustration in the article "What is an exposition?" from the Civil Aviation Safety Authority (CASA) website.
"As the aviation industry transitions to new rules and safety standards through regulatory reform, organisations will be required to demonstrate to the Civil Aviation Safety Authority (CASA) how they have met the requirements outlined in the legislation, including the regulations and manual of standards applicable to their operation through a document called an exposition.
An exposition is a description of how organisations will conduct their operations to maintain the required level of safety. The exposition is the primary document, supported by a series of manuals, such as the operations manual and safety management system manual. These manuals and other supporting documents form part of the exposition document set, as shown in the ... diagram." [casa.gov.au/ scripts/ nc.dll?WCMS:STANDARD::pc=PC_ 101706]
The hub-and-spoke diagram example "CASA exposition" was created using the ConceptDraw PRO diagramming and vector drawing software extended with the Circle-Spoke Diagrams solution from the area "What is a Diagram" of ConceptDraw Solution Park.
Circle-spoke diagram
This ecology infographic example was created on the base of the infographics "Greenhouse gas emissions in the EU" from the Debating Europe website. [debatingeurope.eu/ wp-content/ uploads/ 2013/ 06/ TH_ 2_ social.png]
"A greenhouse gas (sometimes abbreviated GHG) is a gas in an atmosphere that absorbs and emits radiation within the thermal infrared range. This process is the fundamental cause of the greenhouse effect. The primary greenhouse gases in the Earth's atmosphere are water vapor, carbon dioxide, methane, nitrous oxide, and ozone. Greenhouse gases greatly affect the temperature of the Earth; without them, Earth's surface would average about 33 °C colder, which is about 59 °F below the present average of 14 °C (57 °F)." [Greenhouse gas. Wikipedia]
The ecology infographic example "EU greenhouse gas emissions" was created using the ConceptDraw PRO diagramming and vector drawing software extended with the Management Infographics solition from the area "Business Infographics" in ConceptDraw Solution Park.
Ecology infographics example

Used Solutions
- Draw A Flow Chart To Show The Primary Sector Of Any Good The ...
- Primary Sector Image Drawing
- Draw Primary Sector
- A Drawing Of A Picture A Primary Sector
- Diagram Of Primary Industry
- Draw Or Design A Picture That Represents A Product Of Primary ...
- Design A Picture Of Primary Sector
- Draw Or Design A Picture That Represents A Products Of Primary ...
- Flow Chart Of The Primary Sector Secondary Sector And Tertiary ...
- The Flow Chart Of Primary Sector And Secondary Sector And Tertiary
- Draw A Picture That Represent A Product Of Primary Industry
- Diagrames Of Secondary Sector
- Secondary Sector By Drawing Them
- Divided Bar Diagrams | Pictures For Primary Sector For Drawing
- Draw Or Design A Picture Of Primary Sector
- Divided Bar Diagrams | Primary Sector Pictures Easy To Draw
- Draw Or Design A Picture That Represents A Product Of Each ...
- A Picture That Represent A Product Of Primary Sector
- Design A Picture Which Shows Primary Sector
- Draw Or Design A Picture That Represents A Product Of Each Sector