Program Structure Diagram

UML Diagram Types List

The vector stencils library "AWS Database" contains 31 Amazon Web Services database icons: Amazon DynamoDB icons, Amazon ElastiCache icons, Amazon Relational Database Service icons, Amazon Redshift icons, AWS Database Migration Service icons, Amazon DynamoDB Accelerator icon.
Use it to draw Amazon Web Services architecture diagrams with ConceptDraw PRO diagramming and vector drawing software.
"Amazon DynamoDB is a fast and flexible NoSQL database service... It is a fully managed cloud database and supports both document and key-value store models." [aws.amazon.com/ dynamodb/ ]
"ElastiCache is a web service that makes it easy to deploy, operate, and scale an in-memory cache in the cloud." [aws.amazon.com/ elasticache/ ]
"Amazon Relational Database Service (Amazon RDS) makes it easy to set up, operate, and scale a relational database in the cloud. ... Amazon RDS provides you six familiar database engines to choose from, including Amazon Aurora, Oracle, Microsoft SQL Server, PostgreSQL, MySQL and MariaDB." [aws.amazon.com/ rds/ ]
"Amazon Redshift is a fast, fully managed, petabyte-scale data warehouse that makes it simple and cost-effective to analyze all your data using your existing business intelligence tools." [aws.amazon.com/ redshift/ ]
"AWS Database Migration Service helps you migrate databases to AWS easily and securely." [aws.amazon.com/ dms/ ]
The AWS icons example "Design elements - AWS Database" is included in the AWS Architecture Diagrams solution from the Computer and Networks area of ConceptDraw Solution Park.
Amazon Web Services icons
Flow chart Example. Warehouse Flowchart


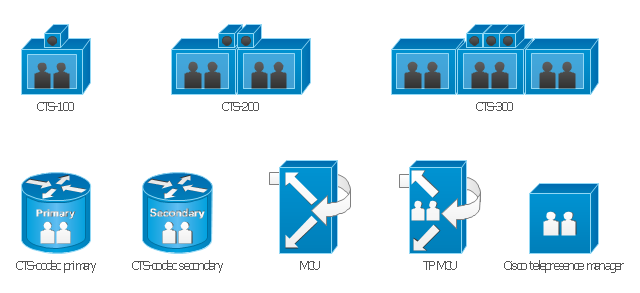
The vector stencils library "Cisco telepresence" contains 8 symbols of videoconference and telepresence equipment: Cisco TelePresence Systems, CTS-codecs primary and secondary, multipoint control unit (MCU), TelePresence MCU (TP MCU), Cisco telepresence manager.
Use it to create the computer network diagrams using the ConceptDraw PRO diagramming and vector drawing software.
"A teleconference or teleseminar is the live exchange and mass articulation of information among several persons and machines remote from one another but linked by a telecommunications system. Terms such as audio conferencing, telephone conferencing and phone conferencing are also sometimes used to refer to teleconferencing.
The telecommunications system may support the teleconference by providing one or more of the following: audio, video, and/ or data services by one or more means, such as telephone, computer, telegraph, teletypewriter, radio, and television." [Teleconference. Wikipedia]
The example "Design elements - Cisco telepresence" is included in the Cisco Network Diagrams solution from the Computer and Networks area of ConceptDraw Solution Park.
Cisco telepresence symbols
How to Construct a Fishbone Diagram

IDEF4 Standard

Network Glossary Definition


Local area network (LAN). Computer and Network Examples
. Computer and Network Examples")
"Ishikawa diagrams (also called fishbone diagrams, herringbone diagrams, cause-and-effect diagrams, or Fishikawa) are causal diagrams created by Kaoru Ishikawa (1968) that show the causes of a specific event. Common uses of the Ishikawa diagram are product design and quality defect prevention, to identify potential factors causing an overall effect. Each cause or reason for imperfection is a source of variation. Causes are usually grouped into major categories to identify these sources of variation. The categories typically include:
- People: Anyone involved with the process
- Methods: How the process is performed and the specific requirements for doing it, such as policies, procedures, rules, regulations and laws
- Machines: Any equipment, computers, tools, etc. required to accomplish the job
- Materials: Raw materials, parts, pens, paper, etc. used to produce the final product
- Measurements: Data generated from the process that are used to evaluate its quality
- Environment: The conditions, such as location, time, temperature, and culture in which the process operates" [Ishikawa diagram. Wikipedia]
The fishbone diagram example "Causes of low-quality output" was created using the ConceptDraw PRO diagramming and vector drawing software extended with the Fishbone Diagrams solution from the Management area of ConceptDraw Solution Park.
Ishikawa diagram

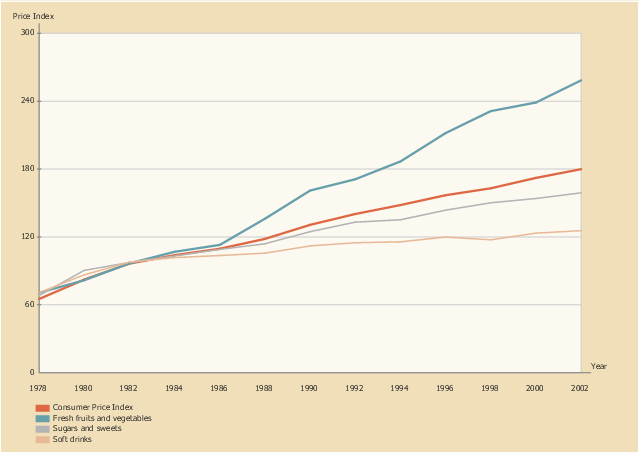
This line graph sample shows the relative price changes for fresh fruits and vegetables, sugars and sweets, and soft drinks, using the period 1982–84 as the baseline (index = 100), 1978–2002. It was designed on the base of line chart from the website of the U.S. National Center for Chronic Disease Prevention and Health Promotion.
"The number of overweight and obese youth has increased in recent decades, yet few data assess how the lives of children have changed during the “obesity epidemic.” ...
Eating as a primary activity declined, suggesting a shift toward snacking or eating as a secondary activity. Statistically significant trends exist for carbohydrate intake, especially for chips/ crackers/ popcorn/ pretzels (intake tripled from the mid-1970s to the mid-1990s) and soft drinks (intake doubled during the same period). Price and income data suggest possible economic reasons for these changes. The percentage of disposable income spent on food has declined continuously, and almost all of the decline has been represented by food consumed at home, yet today’s disposable income buys more calories than it has in the past. Relative prices have encouraged shifts across food types. From a baseline of 100 during 1982–84, the price index for fresh fruit and vegetables increased to 258 by 2002 (far exceeding general inflation), whereas the price index for soft drinks increased only to 126 by 2002 (below general inflation)." [cdc.gov/ pcd/ issues/ 2005/ apr/ 04_ 0039.htm]
The line chart example "Relative price changes for fresh fruits and vegetables, sugars, sweets, soft drinks" was created using the ConceptDraw PRO diagramming and vector drawing software extended with the Line Graphs solution from the Graphs and Charts area of ConceptDraw Solution Park.
Line chart
Cisco Telepresence. Cisco icons, shapes, stencils and symbols
")
Netflow architecture. Computer and Network Examples

Defensive Formation – 4-3 Defense Diagram

- Analysis Tree Diagram Of Secondary Data
- Primary And Secondary Data With Flow Chart
- Flow Chart Of Clothing Including Primary Sector Secondary Sector ...
- UML Diagram Types List | Primary And Secondarydata Flow Chart
- Sector diagram - Template | Economic sector weightings | New ...
- Astronomy Symbols | Mathematics Symbols | IDEF1X Standard ...
- Data Flow Diagram Examples For Android Application
- How to Draw an Organization Chart | Organizational Structure ...
- Amazon Redshift Icon
- Design elements - AWS Database | AWS Database - Vector stencils ...
- Data Base Symbols
- Organizational Structure | Organizational Structure Diagram ...
- Entity Relationship Diagram Examples | Database Design | Data ...
- Fishbone diagram - Template | Ishikawa diagram - Factors reducing ...
- Computer peripheral devices - Vector stencils library | TV, Photo and ...
- Sales Process Flowchart. Flowchart Examples | Sales Process ...
- Bar Diagrams for Problem Solving. Create economics and financial ...
- Fishbone diagram - HAN project | CORRECTIVE ACTIONS ...
- Entity Relationship Diagram Symbols | Software development with ...
- Pictures of Vegetables | Relative price changes for fresh fruits and ...