This site uses cookies. By continuing to browse the ConceptDraw site you are agreeing to our Use of Site Cookies.

Circular Flow Diagram Template

You need to draw the Circular Arrows Diagram, Segmented Diagram or Circular Flow Diagram? Any of these diagrams can be fast and easy designed in ConceptDraw DIAGRAM.

ConceptDraw DIAGRAM diagramming and vector drawing software offers the Circular Arrows Diagrams Solution from the "Diagrams" Area with extensive drawing tools, predesigned samples and circular flow diagram template. Use of ready template is the easiest way of drawing.

Technical Flow Chart

Flow chart is a diagrammatic representation of an algorithm and essential part of planning the system. Flow charts are widely used in technical analysis and programming for easy writing programs and explaining them to others. So, one of the most popular type of flow charts is Technical Flow Chart.
Technical Flow Chart can be drawn by pencil on the paper, but it will be easier to use for designing a special software. ConceptDraw DIAGRAM diagramming and vector drawing software extended with Flowcharts Solution from the "Diagrams" Area of ConceptDraw Solution Park will be useful for this goal.

Structured Systems Analysis and Design Method. SSADM with ConceptDraw DIAGRAM

Structured Systems Analysis and Design Method (SSADM) was developed in the UK in the early 1980s and accepted in 1993 in order to analyze and project the information systems. Use the data flow diagrams (DFD) for describing the informational, functional and event-trigger models, the Logical Data Structure (LDS) diagrams for describing which data the system operates with and Entity Life History (ELH) diagrams for modelling events that happened in the system and find it simple to make any of these or other diagrams with help of our software. Starting now, you’ll definitely make a better chart tomorrow, so why not to do it now, at this very moment? Once you get used to ConceptDraw DIAGRAM , you’ll find our product to be the most smart version of any existing applications and you’ll recommend it to all those who you care for to simplify their work and their lives.
HelpDesk

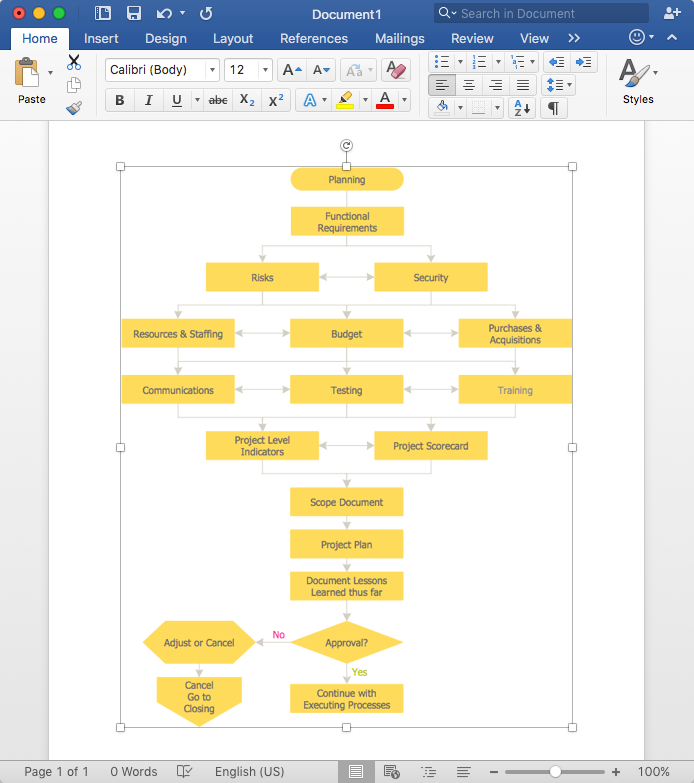
How to Add a Flowchart to MS Word Document

ConceptDraw DIAGRAM allows you to easily create flowcharts and then insert them into a MS Word document.

Flowchart design. Flowchart symbols, shapes, stencils and icons

A flowchart is a type of diagram that represents an algorithm, workflow or process, showing the steps as boxes of various kinds - flowchart symbols, and their order by connecting them with arrows.
Mavericks have always desired to stand apart and gorgeous design is the recipe for that. Any business graphic document will be more understandable if will use an expository color scheme for their parts. Flowchart design makes versatile presenting and explaining of the process and gives a fresh view that distinguishes it from black and white flowcharts on a paper. Workflow diagram or process flow diagrams become more understandable to ordinary people when it use minimum symbols and special signs.
The best design can be accomplished by starting from any of the suitable Conceptdraw examples. Pick one of them and begin to input proper text into each Flowchart symbols and shapes. Apply less colors in the document and don't turn into rainbow your diagram, three or four will be enough, also note that business process flowchart may not contain bright color hues. The next clue is to use identical colors for same flowchart shape types.
Business Process Modeling with ConceptDraw
Business Process Modeling with ConceptDraw "Business Process Diagrams" Solution

UML Diagram Visio

This sample shows the UML Class Diagram that was created in ConceptDraw DIAGRAM on the Mac and then was opened for editing in MS Visio.
Using the 13 libraries of the Rapid UML Solution for ConceptDraw DIAGRAM you can create your own visual vector UML diagrams quick and easy.
"Data flow diagrams are one of the three essential perspectives of the structured-systems analysis and design method SSADM. The sponsor of a project and the end users will need to be briefed and consulted throughout all stages of a system's evolution. With a data flow diagram, users are able to visualize how the system will operate, what the system will accomplish, and how the system will be implemented. The old system's dataflow diagrams can be drawn up and compared with the new system's data flow diagrams to draw comparisons to implement a more efficient system. Data flow diagrams can be used to provide the end user with a physical idea of where the data they input ultimately has an effect upon the structure of the whole system from order to dispatch to report. How any system is developed can be determined through a data flow diagram model.
In the course of developing a set of levelled data flow diagrams the analyst/ designers is forced to address how the system may be decomposed into component sub-systems, and to identify the transaction data in the data model.
Data flow diagrams can be used in both Analysis and Design phase of the SDLC.
There are different notations to draw data flow diagrams (Yourdon & Coad and Gane & Sarson), defining different visual representations for processes, data stores, data flow, and external entities." [Data flow diagram. Wikipedia]
The DFD (Yourdon and Coad notation) example "Process of account receivable" was created using the ConceptDraw PRO diagramming and vector drawing software extended with the Data Flow Diagrams solution from the Software Development area of ConceptDraw Solution Park.
Data Flow Diagram
Data Flow Diagram, process, external interactor, data store,

Data Flow Diagram Symbols. DFD Library

Data Flow Diagrams show information transfers and process steps of a system. The general concept is an approach of a depicting how occurs input in a system, further processes and what runs out. The aim of DFD is in accomplishing of understanding between developers and users. Data flow diagrams are maintained with other methods of structured systems analysis.

Design Data Flow. DFD Library

Three DFD libraries, 49 vector shapes. Use these DFD symbol libraries to design the process-oriented models, data-oriented models, data flowcharts, data process diagrams, structured analysis diagrams, and information flow diagrams.

Program Evaluation and Review Technique (PERT) with ConceptDraw DIAGRAM

PERT Diagram is a more realistic approach of a project's time estimate analysis. After PERT chart was constructed user can discover the shortest possible duration for entire project timescale. The project timeline is the longest chain that might be taken with connected tasks on the PERT Diagram. Completion of serial tasks need to be accomplished in a presented order. At a project timeline can be independent tasks that not linked with main sequence they are called parallel tasks. PERT diagram is more suitable for Critical Path Analysis than Gantt chart for the reason that it undoubtedly better determine task dependencies. Project managers customarily utilize both methodologies.