"A process flow diagram (PFD) is a diagram commonly used in chemical and process engineering to indicate the general flow of plant processes and equipment. The PFD displays the relationship between major equipment of a plant facility and does not show minor details such as piping details and designations. Another commonly used term for a PFD is a flowsheet. ...
Process flow diagrams of multiple process units within a large industrial plant will usually contain less detail and may be called block flow diagrams or schematic flow diagrams." [Process flow diagram. Wikipedia]
The process flow diagram (PFD) template for the ConceptDraw PRO diagramming and vector drawing software is included in the Chemical and Process Engineering solution from the Engineering area of ConceptDraw Solution Park.
Process flow diagram (PFD) template
-template-process-flow-diagram-(pfd)-template.png--diagram-flowchart-example.png)
How To use House Electrical Plan Software


Flowchart Software


Fishbone Diagram Problem Solving

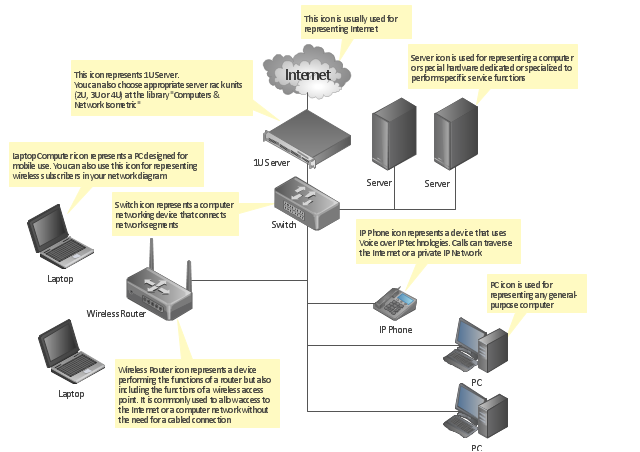
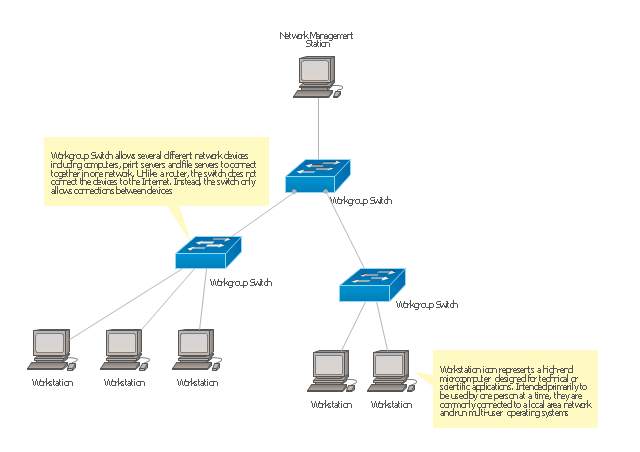
"A computer network diagram is a schematic depicting the nodes and connections amongst nodes in a computer network or, more generally, any telecommunications network. ...
Readily identifiable icons are used to depict common network appliances e.g. Router, and the style of lines between them indicate the type of connection. Clouds are used to represent networks external to the one pictured for the purposes of depicting connections between internal and external devices, without indicating the specifics of the outside network. ...
At different scales diagrams may represent various levels of network granularity. At the LAN level, individual nodes may represent individual physical devices, such as hubs or file servers, while at the WAN level, individual nodes may represent entire cities. In addition, when the scope of a diagram crosses the common LAN/ MAN/ WAN boundaries, representative hypothetical devices may be depicted instead of showing all actually existing nodes." [Computer network diagram. Wikipedia]
The computer network diagram template for the ConceptDraw PRO diagramming and vector drawing software is included in the Computer and Networks solution from the Computer and Networks area of ConceptDraw Solution Park.
Computer network diagram template
Stakeholder Onion Diagram Template

Use this Cisco network diagram template to visualize the computer networks topology and equipment connections and arrangement using the ConceptDraw PRO diagramming and vector drawing software.
"A computer network diagram is a schematic depicting the nodes and connections amongst nodes in a computer network or, more generally, any telecommunications network. ...
Readily identifiable icons are used to depict common network appliances e.g. Router, and the style of lines between them indicate the type of connection. Clouds are used to represent networks external to the one pictured for the purposes of depicting connections between internal and external devices, without indicating the specifics of the outside network. ...
Cisco uses its own brand of networking symbols. Since Cisco has a large Internet presence and designs a broad variety of network devices, its list of symbols ("Network Topology Icons") is exhaustive." [Computer network diagram. Wikipedia]
This Cisco network diagram template is included in the Cisco Network Diagrams solution from the Computer and Networks area of ConceptDraw Solution Park.
Cisco network diagram
Flowchart Components

Process Flowchart


 Computer Network Diagrams
Computer Network Diagrams solution extends ConceptDraw PRO software with samples, templates and libraries of vector icons and objects of computer network devices and network components to help you create professional-looking Computer Network Diagrams, to plan simple home networks and complex computer network configurations for large buildings, to represent their schemes in a comprehensible graphical view, to document computer networks configurations, to depict the interactions between network's components, the used protocols and topologies, to represent physical and logical network structures, to compare visually different topologies and to depict their combinations, to represent in details the network structure with help of schemes, to study and analyze the network configurations, to communicate effectively to engineers, stakeholders and end-users, to track network working and troubleshoot, if necessary.
- Timeline Schematic Template
- Process Flowchart | Treadmill Schematic Architecture Template
- Cisco Network Templates | Network layout floorplan - Template ...
- Context Diagram Template | Block Diagram | Functional Flow Block ...
- Professional Schematic Template
- Schematic Diagram Of An Autoclave
- Draw And Labeled A Schematic Diagram Of An Agitator
- Functional Flow Block Diagram | 3D Block diagram - Template ...
- Logic gate diagram - Template | Electrical Symbols, Electrical ...