 Total Quality Management TQM Diagrams
Total Quality Management Diagrams solution extends ConceptDraw DIAGRAM software with samples, templates and vector stencils library for drawing the TQM flowcharts.
 Block Diagrams
Block diagrams solution extends ConceptDraw DIAGRAM software with templates, samples and libraries of vector stencils for drawing the block diagrams.
Bubble diagrams in Landscape Design with ConceptDraw DIAGRAM

HelpDesk
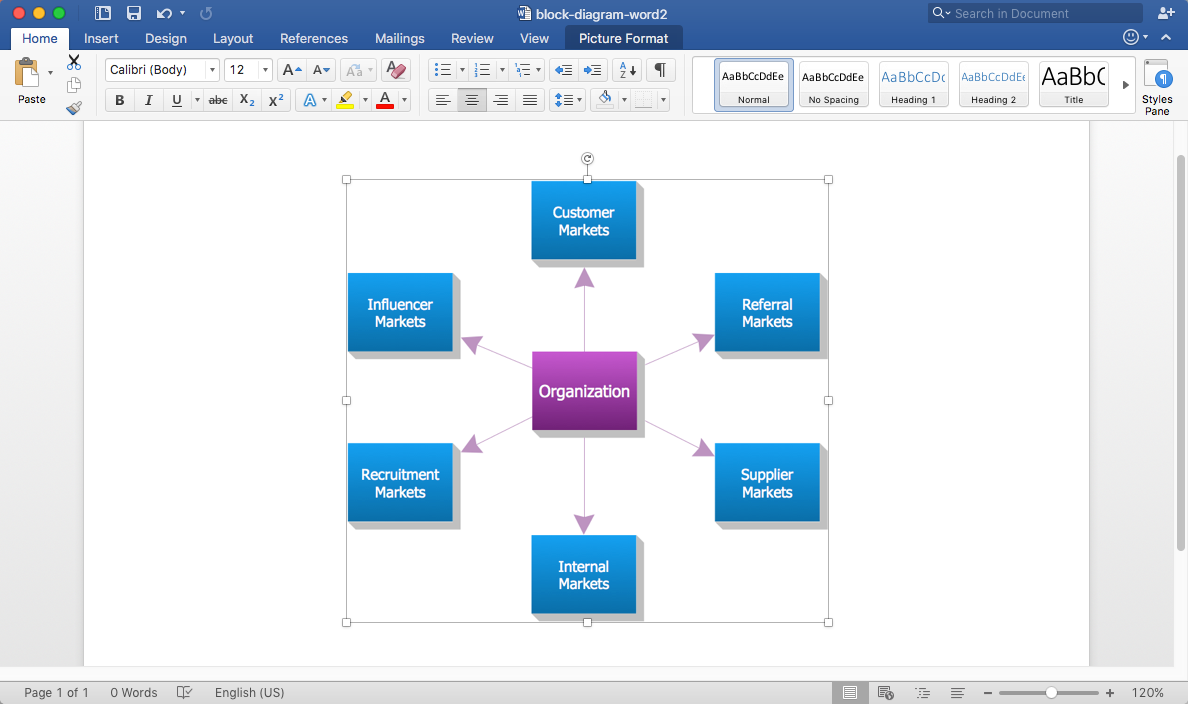
How to Add a Block Diagram to an MS Word ™ Document
 Electrical Engineering
This solution extends ConceptDraw DIAGRAM.9.5 (or later) with electrical engineering samples, electrical schematic symbols, electrical diagram symbols, templates and libraries of design elements, to help you design electrical schematics, digital and analog
 Chemical and Process Engineering
This chemical engineering solution extends ConceptDraw DIAGRAM.9.5 (or later) with process flow diagram symbols, samples, process diagrams templates and libraries of design elements for creating process and instrumentation diagrams, block flow diagrams (BFD
HelpDesk
How to Add a Block Diagram to a PowerPoint Presentation

 Cisco Network Diagrams
Cisco Network Diagrams solution extends ConceptDraw DIAGRAM with the best characteristics of network diagramming software. Included samples, templates and libraries of built-in standardized vector Cisco network icons and Cisco symbols of computers, network devices, network appliances and other Cisco network equipment will help network engineers, network designers, network and system administrators, as well as other IT professionals and corporate IT departments to diagram efficiently the network infrastructure, to visualize computer networks topologies, to design Cisco computer networks, and to create professional-looking Cisco Computer network diagrams, Cisco network designs and schematics, Network maps, and Network topology diagrams in minutes.
 Interactive Voice Response Diagrams
Interactive Voice Response Diagrams solution extends ConceptDraw DIAGRAM software with samples, templates and libraries of ready-to-use vector stencils that help create Interactive Voice Response (IVR) diagrams illustrating in details a work of interactive voice response system, the IVR system’s logical and physical structure, Voice-over-Internet Protocol (VoIP) diagrams, and Action VoIP diagrams with representing voice actions on them, to visualize how the computers interact with callers through voice recognition and dual-tone multi-frequency signaling (DTMF) keypad inputs.
 Telecommunication Network Diagrams
Telecommunication Network Diagrams solution extends ConceptDraw DIAGRAM software with samples, templates, and great collection of vector stencils to help the specialists in a field of networks and telecommunications, as well as other users to create Computer systems networking and Telecommunication network diagrams for various fields, to organize the work of call centers, to design the GPRS networks and GPS navigational systems, mobile, satellite and hybrid communication networks, to construct the mobile TV networks and wireless broadband networks.
HelpDesk
How to Create a CCTV Diagram

 Venn Diagrams
Venn Diagrams are actively used to illustrate simple set relationships in set theory and probability theory, logic and statistics, mathematics and computer science, linguistics, sociology, and marketing. Venn Diagrams are also often used to visually summarize the status and future viability of a project.
- Total Quality Management TQM Diagrams
- Schematic Diagramtotal Quality Management Pdf
- Total Quality Management TQM Diagrams
- Electrial Electronics Symbols And System Block Diagrams Pdf
- Electronics Block Diagrams And Symbols Pdf
- Block Daigram In Quality Control And Management Pdf
- Process And Geographical Management Block Diagram
- UML Block Diagram | Block Diagram | Functional Block Diagram ...
- Electrical Symbols, Electrical Diagram Symbols | Block Diagram ...
- Topology Block Diagram Pdf
- Block Diagram Processes Examples Pdf
- Block Diagram Creator | Block Diagram | Electrical Symbols ...
- Design elements - TQM diagram | How to Create a TQM Diagram ...
- Electrical Diagram | Gym Layout | Electrical Engineering | Pdf Of ...
- Topologies Block Diagram Pdf
- Total Quality Management TQM Diagrams
- Define A Block Diagram In Elect Engineering
- Mechanical Engineering Quality Control Pdf
- Tqm Block Diagram And Photos