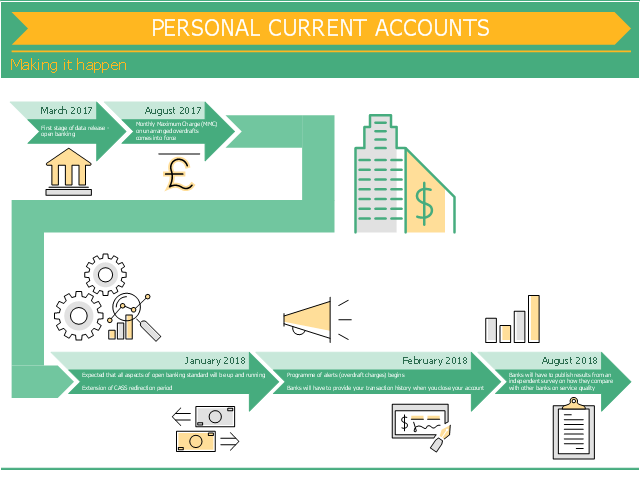
This finance infographic sample was designed on the base of the infographic "Personal current accounts Making it happen" from the the UK Government website. [gov.uk/ government/ uploads/ system/ uploads/ attachment_ data/ file/ 588882/ pcas-timeline-making-it-happen.pdf]
Contains public sector information licensed under the Open Government Licence v3.0.
"In banking "personal account" refers to one's account at the bank that is used for non-business purposes. Most likely, the service at the bank consists of one of two kinds of accounts or sometimes both: a savings account and a current account.
Banks differentiate their services for personal accounts from business accounts by setting lower minimum balance requirements, lower fees, free checks, free ATM usage, free debit card (Check card) usage, etc." [Personal account. Wikipedia]
The finance infographic sample "Personal current accounts timeline" was designed using ConceptDraw PRO software extended with Finanlial Infographics solution from Business Infographic area of ConceptDraw Solution Park.
Financial infogram
How to Report Task's Execution with Gantt Chart

Business Process Mapping — How to Map a Work Process

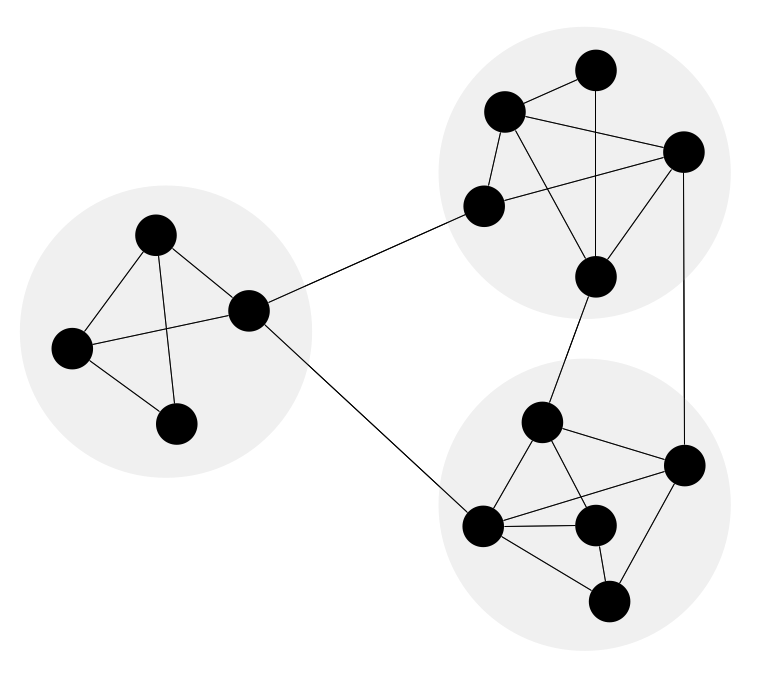
Network Community Structure. Computer and Network Examples

Examples of Flowcharts, Org Charts and More


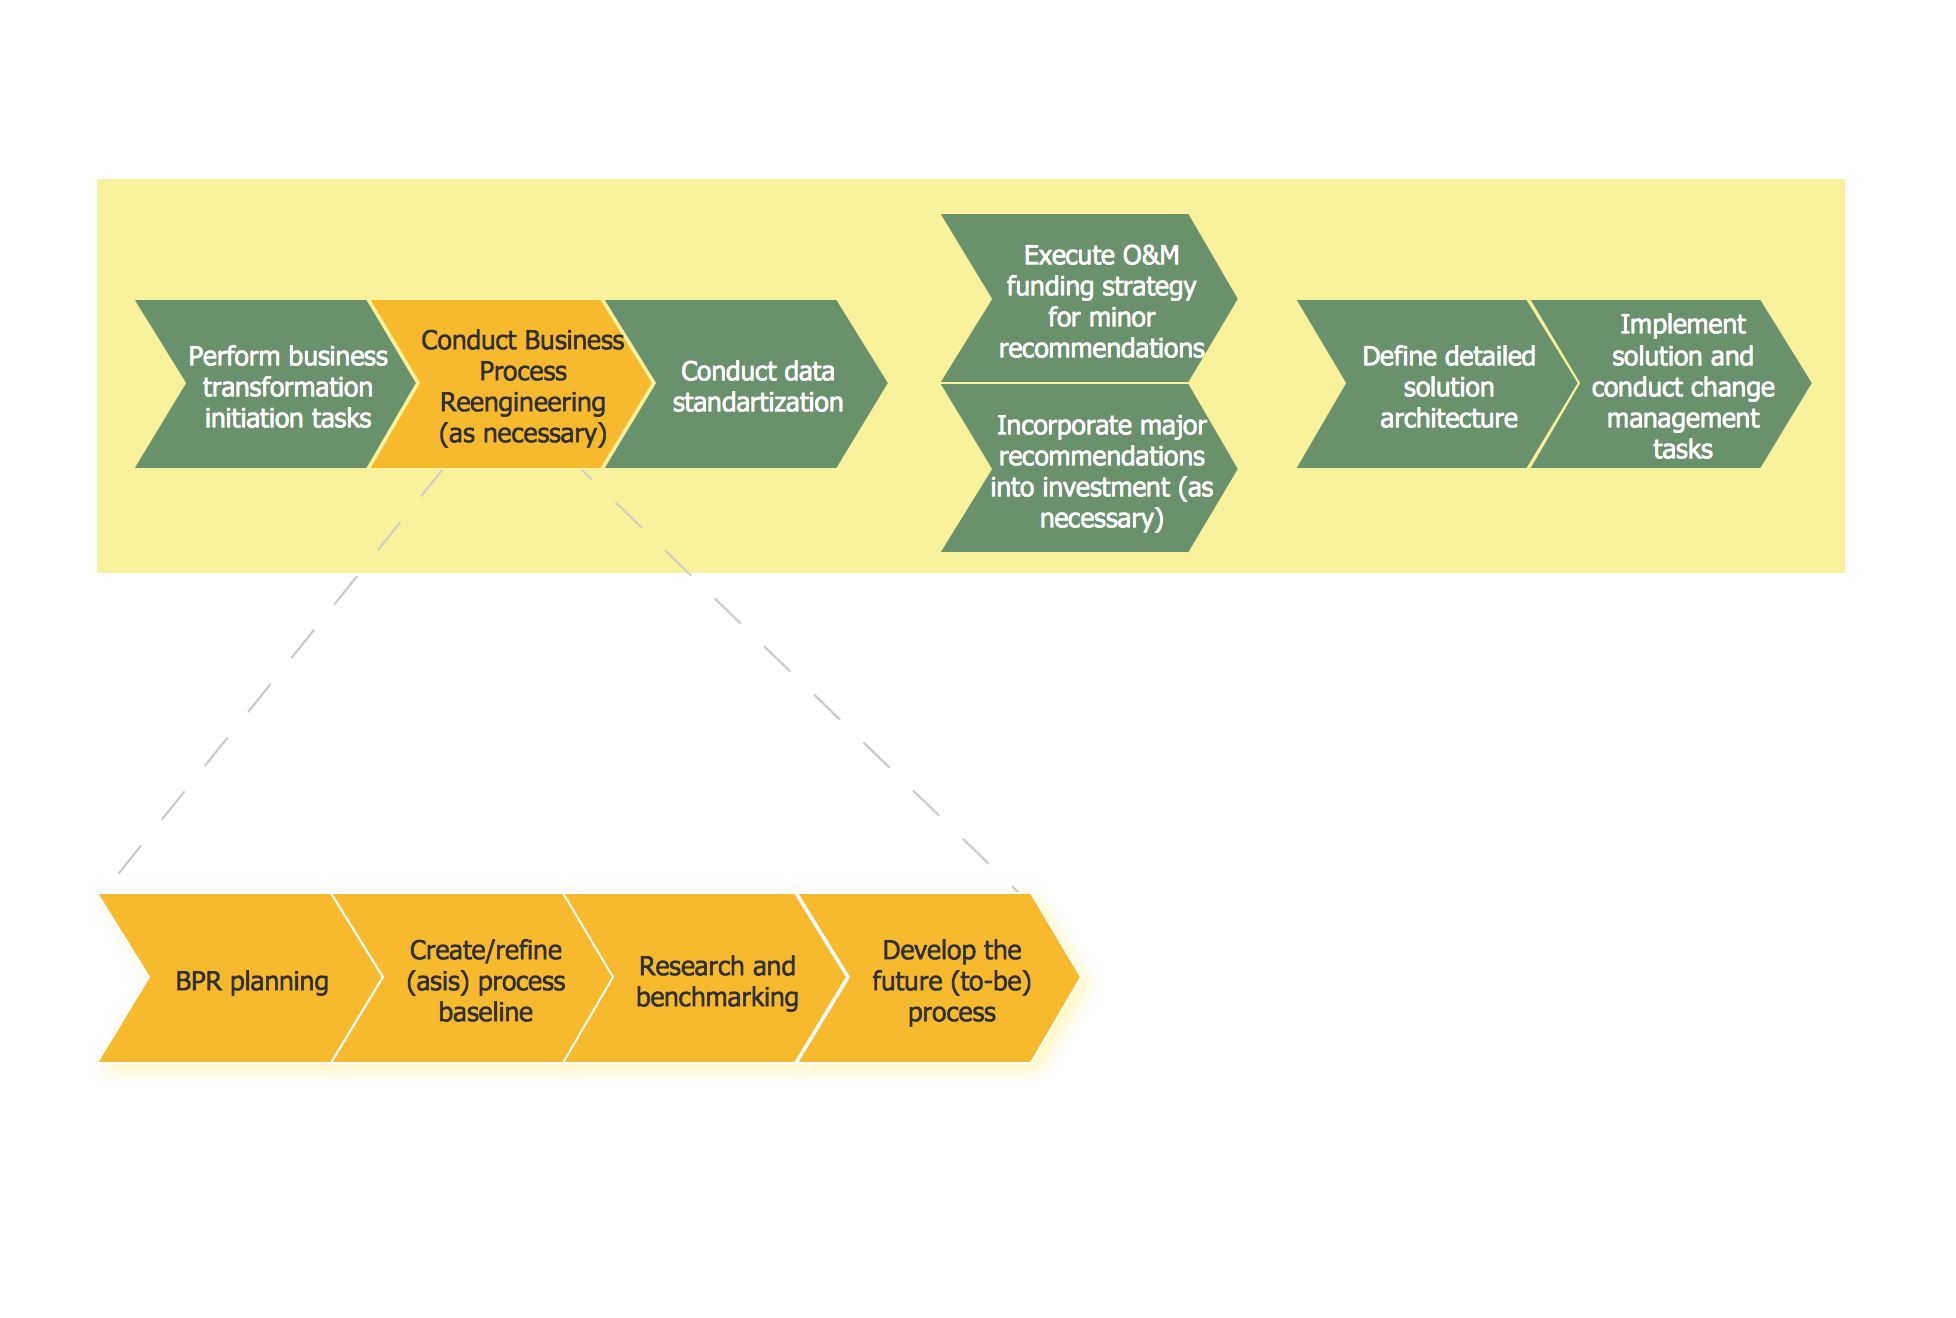
Business Process Reengineering Examples
Swim Lane Flowchart Symbols

Create Fishbone Diagrams with the ConceptDraw

Program Evaluation and Review Technique (PERT) with ConceptDraw DIAGRAM

- How to Create a Timeline Diagram in ConceptDraw PRO | Design ...
- Timeline Examples | Project Timeline | How to Make a Timeline ...
- Bank Detailed Answers | UML activity diagram - Cash withdrawal ...
- PM Personal Time Management | Timeline Diagrams | Time Series ...
- PM Personal Time Management | Total Quality Management TQM ...
- Project Timeline | Timeline Examples | How to Make a Timeline ...
- Project Timeline | Timeline Examples | Timeline Diagrams ...
- Pyramid Diagram | Project Timeline | Project — Assigning ...
- ATM Sequence diagram | ATM UML Diagrams | Timeline Diagrams ...
- Event-driven Process Chain Diagrams | Timeline Diagrams ...