 PM Personal Time Management
This solution extends all ConceptDraw Office 2.0 products providing every project participant with a track timeframe, workspace and role in a project with the help of Microreports, calendars, and to-do lists.
 Timeline Diagrams
Timeline Diagrams solution extends ConceptDraw PRO diagramming software with samples, templates and libraries of specially developed smart vector design elements of timeline bars, time intervals, milestones, events, today marker, legend, and many other elements with custom properties, helpful for professional drawing clear and intuitive Timeline Diagrams. Use it to design simple Timeline Diagrams and designate only the main project stages, or highly detailed Timeline Diagrams depicting all project tasks, subtasks, milestones, deadlines, responsible persons and other description information, ideal for applying in presentations, reports, education materials, and other documentation.
 Time Series Dashboard
Time series dashboard solution extends ConceptDraw PRO software with templates, samples and vector stencils libraries with charts, graphs and plots for drawing the visual dashboards showing data time series.
HelpDesk
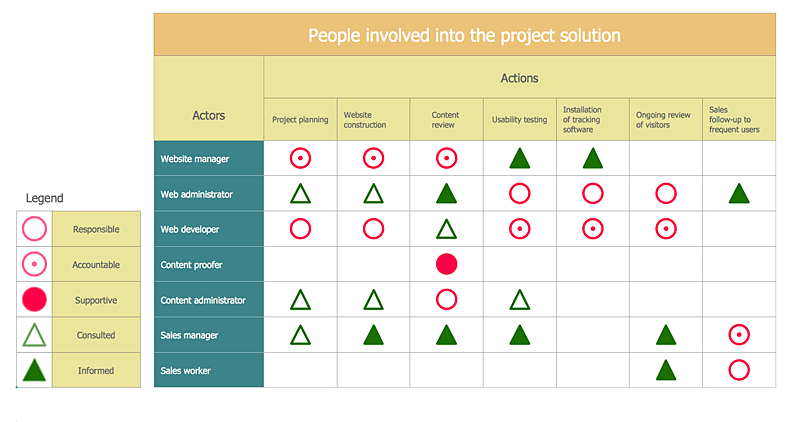
How To Create an Involvement Matrix
The Involvement Matrix can identify the distribution of responsibilities and identify roles in a group or team. This matrix can be used company wide. The Involvement Matrix identifies participants who are involved in corrective actions. The Involvement Matrix is constructed for all highly prioritized corrective actions. It uses symbols to assign who participates, performs, consults, should be informed, checks the work, and accepts the results. Using visual diagrams keeps ideas clear and is very effective when discussing the problem and a description of the solution. They are great at helping to quickly see what stage of the problem-solving effort is currently underway.It defines the participants and their roles. The matrix displays all of the parties involved, defines their level of involvement, and the nature of their participation. The ability to create an Involvement Matrix is supported by the ConceptDraw Seven Management and Planning Tools solution.- PROBLEM ANALYSIS. Prioritization Matrix | How To Create a ...
- Competitive feature comparison matrix chart - Digital scouting ...
- Pyramid Diagram | Pyramid Diagram | How To Create a Prioritization ...
- SWOT analysis matrix diagram templates | Competitor Analysis ...
- Matrix Diagram Between Prioritization Diagram
- Matrix Chart Template
- How To Create a Prioritization Matrix | Prioritization matrix ...
- Matrix Organization Structure | How to Draw a Matrix Organizational ...
- PROBLEM ANALYSIS. Prioritization Matrix | Problem solving ...
- How To Create a Prioritization Matrix | Prioritization Matrix ...
- Matrix Flow Chart
- Pyramid Diagram | PROBLEM ANALYSIS. Prioritization Matrix ...
- Process Flowchart | SWOT analysis matrix diagram templates | How ...
- Time Management Matrix Template
- Matrix Organization Structure | How to Draw a Matrix Organizational ...
- Matrix Organization Structure | SWOT Matrix Template | Authority ...
- PM Response | SWOT and TOWS Matrix Diagrams | Process Flow ...
- Matrix Table Chart Sample
- SWOT matrix template | How To Create a Prioritization Matrix | How ...
- Competitive feature comparison matrix chart
