When developing a business plan it is very important to accurately represent the structure and visually outline all important information. A business plan usually has a clear hierarchical structure. The Mind Maps are particularly effective to describe such structures, they are one of the most powerful and visually intuitive tools for the tasks of structuring and memorizing large amounts of information. The Mind Maps are indispensable in development the complex projects, in preparation and discussion of business plans, in designing the presentations, in process of decision making, holding brainstorming, time management, etc.
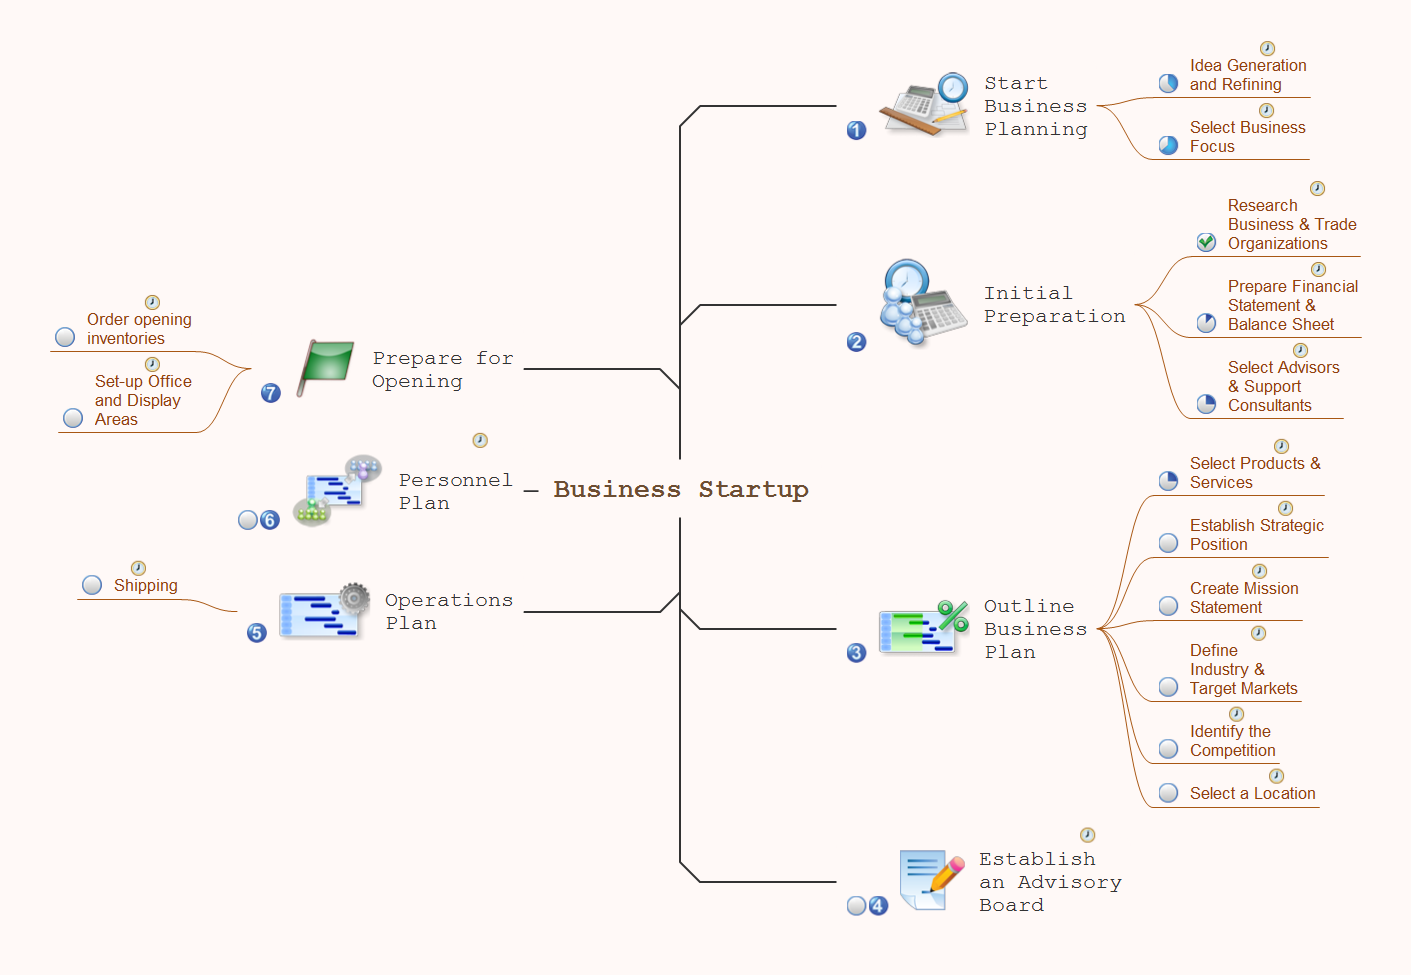
As for the software for working with Mind Maps, particularly effective is a cross-platform ConceptDraw MINDMAP software for Windows and Mac OS X. It provides many tools that help in business plan preparation for organizing the new business, in developing a business plan for promotion some product, etc. ConceptDraw MINDMAP supports the multipage documents, the export and import into popular applications MS PowerPoint, MS Word, PDF, MindManager, in project management applications ConceptDraw Project and MS Project, and in various graphical formats. You can to observe a Mind Map of a business plan for computer hardware reseller designed in ConceptDraw MINDMAP.