Prioritization Matrix
You can design the Prioritization Matrix by hand on the paper, but we offer you the most easier way — to use the ConceptDraw DIAGRAM diagramming and vector drawing software extended with Seven Management and Planning Tools Solution from the Management Area.Network Gateway Router
Use ConceptDraw DIAGRAM diagramming and vector drawing software enhanced with Computer and networks solution to draw different types of network diagrams: physical layout and topology, LAN and WAN, Cisco, Apple, Wi-Fi wireless and Ethernet wired networks, etc.Special libraries of highly detailed, accurate shapes and computer graphics, servers, hubs, switches, printers, mainframes, face plates, routers etc.
Relative Value Chart Software
Relative value is a value measured in the terms of liquidity, risks, return of one investment or financial instrument relative to another.Relative values are widely used in:business, economics, investment, management, marketing, statistics, etc.
ConceptDraw DIAGRAM software is the best for drawing professional looking Relative Value Charts. ConceptDraw DIAGRAM provides Divided Bar Diagrams solution from the Graphs and Charts Area of ConceptDraw Solution Park.
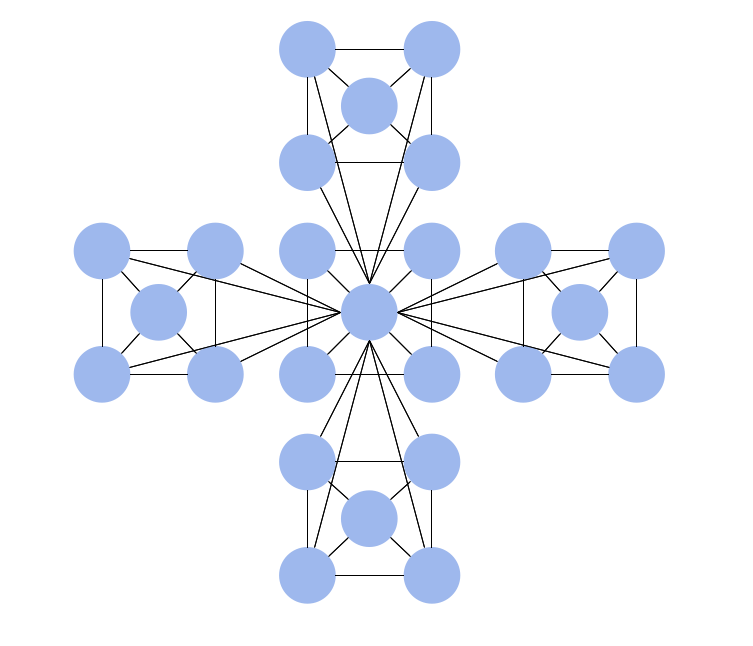
Star Network Topology
The Computer and Networks solution from Computer and Networks area of ConceptDraw Solution Park provides examples, templates and vector stencils library with symbols of local area network (LAN) and wireless LAN (WLAN) equipment.Use it to draw the physical and logical network topology diagrams for wired and wireless computer communication networks.
Wireless Network Mode
Wireless Networks solution from ConceptDraw Solution Park extends ConceptDraw DIAGRAM to help network engineers and designers efficiently illustrate wireless network mode diagrams.Hierarchical Network Topology
This sample was created in ConceptDraw DIAGRAM diagramming and vector drawing software using the Computer and Networks solution from Computer and Networks area of ConceptDraw Solution Park.This sample shows the Hierarchical network topology.
A Hierarchical network topology interconnects multiple groups that are located on the separate layers to form a larger network. Each layer concentrates on the specified functions, this allows to choose the right equipment for the layer.
The vector stencils library "Management" contains 20 management icons.
Use it to design your business and finance illustrations and infographics
with ConceptDraw PRO diagramming and vector drawing software.
The vector stencils library "Management" is included in the Business and Finance solution from the Illustration area of ConceptDraw Solution Park.
Use it to design your business and finance illustrations and infographics
with ConceptDraw PRO diagramming and vector drawing software.
The vector stencils library "Management" is included in the Business and Finance solution from the Illustration area of ConceptDraw Solution Park.
Metropolitan area networks (MAN). Computer and Network Examples
Metropolitan Area Network combines local networks located within a city, and is based on high data rate compounds, implemented on the basis of fiber channels and other digital data transmission channels. Now, with the increasing number of network communities, wireless local area networks based on 802.11b standard are combined into a wireless metropolitan area network consisting of affordable antenna systems and consumer-grade wireless equipment using 802.11a and 802.11b standards.Business Process Flow Diagram
Business Process Flow Diagram is a graphical presentation of business processes and process flows. It is one of the main tool of business analysis and business process re-engineering that lets identify and easy understand process flows within organization.ConceptDraw DIAGRAM extended with Business Process Workflow Diagrams solution from the Business Processes area of ConceptDraw Solution Park is a powerful software which lets easy design Business Process Flow Diagram of any complexity.
Sales Process Flowchart Symbols
The most easier way of creating the visually engaging and informative Sales Process Flowchart is to create the new ConceptDraw document and to use the predesigned vector symbols offered in 6 libraries of the Sales Flowchart Solution. There are more than six types of sales process flow diagrams, ConceptDraw DIAGRAM software is flowchart maker which include six collections of extended flowchart symbols for effective diagramming. There are main collections of color coded flowchart symbols: Sales Department, Sales Steps, Sales Workflow, Sales Symbols and special set of Sales Arrows and Sales Flowchart.- Process Flowchart | Investment and construction application ...
- Investment Png
- Investment Vector Png
- Opportunity prioritization matrix | New business opportunity SWOT ...
- SWOT Matrix Template | Prioritization matrix - Template | TOWS ...
- Pie Donut Chart. Pie Chart Examples | Competitor Analysis | SWOT ...
- Venn Diagram Examples for Problem Solving. Environmental Social ...
- Bar Diagrams for Problem Solving. Create manufacturing and ...
- Chart Examples | Pie Chart Examples and Templates | Business ...
- Basic Diagramming | Flow chart Example. Warehouse Flowchart ...
- ERD | Entity Relationship Diagrams, ERD Software for Mac and Win
- Flowchart | Basic Flowchart Symbols and Meaning
- Flowchart | Flowchart Design - Symbols, Shapes, Stencils and Icons
- Flowchart | Flow Chart Symbols
- Electrical | Electrical Drawing - Wiring and Circuits Schematics
- Flowchart | Common Flowchart Symbols