This example was designed on the base of the diagram from the "BYOD Guidance: BlackBerry Secure Work Space" on the website of the UK Communications Electronics Security Group (CESG).
"Secure Work Space (SWS) for iOS and Android is a containerisation, application-wrapping and secure connectivity option that delivers a higher level of control and security to iOS and Android devices, all managed through the BlackBerry Enterprise Service (BES) administration console.
Work space applications are secured and separated from personal applications and data. The work space applications include an integrated email, calendar, and contacts application, an enterprise-level secure browser, and a secure document viewing and editing application.
The work browser allows users to securely browse the organisation’s intranet and the Internet. If the device is lost or the employee leaves the organisation, you can chose to delete only corporate information or all information from the device.
...
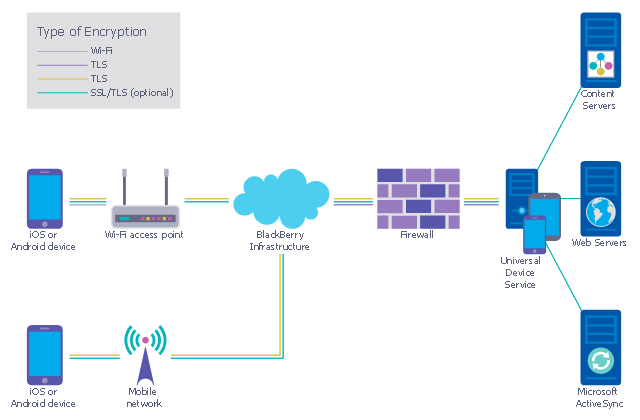
Recommended network architecture
The walled garden architecture, shown below, aims to limit the impact of a compromise of an EUD and isolate high risk components from high value components where possible. The enterprise servers installed as part of SWS are high value resources that require suitable protection but are also high risk; they perform complex processing tasks that are more likely to contain exploitable vulnerabilities. These competing priorities make securely placing the servers into an existing network challenging, and organisations that wish to deviate from this architecture below should ensure they understand the risks of doing so."
[cesg.gov.uk/ guidance/ byod-guidance-blackberry-secure-work-space]
The cybersecurity diagram example "Recommended network architecture for BlackBerry SWS" was created using the ConceprDraw PRO software extended with the Network Security Diagrams solution from the Computer and Neworks area of ConceptDraw Solution Park.
"Secure Work Space (SWS) for iOS and Android is a containerisation, application-wrapping and secure connectivity option that delivers a higher level of control and security to iOS and Android devices, all managed through the BlackBerry Enterprise Service (BES) administration console.
Work space applications are secured and separated from personal applications and data. The work space applications include an integrated email, calendar, and contacts application, an enterprise-level secure browser, and a secure document viewing and editing application.
The work browser allows users to securely browse the organisation’s intranet and the Internet. If the device is lost or the employee leaves the organisation, you can chose to delete only corporate information or all information from the device.
...
Recommended network architecture
The walled garden architecture, shown below, aims to limit the impact of a compromise of an EUD and isolate high risk components from high value components where possible. The enterprise servers installed as part of SWS are high value resources that require suitable protection but are also high risk; they perform complex processing tasks that are more likely to contain exploitable vulnerabilities. These competing priorities make securely placing the servers into an existing network challenging, and organisations that wish to deviate from this architecture below should ensure they understand the risks of doing so."
[cesg.gov.uk/ guidance/ byod-guidance-blackberry-secure-work-space]
The cybersecurity diagram example "Recommended network architecture for BlackBerry SWS" was created using the ConceprDraw PRO software extended with the Network Security Diagrams solution from the Computer and Neworks area of ConceptDraw Solution Park.
Computer security diagram
Create Fishbone Diagrams

What's the best ERD tool for the Mac?

How to Draw Workflow Diagram

Network Security Diagram

Network Security Model

"Business process improvement (BPI) is a systematic approach to help an organization optimize its underlying processes to achieve more efficient results. ...
An organization is only as good as its processes. To be able to make the necessary changes in an organization, one needs to understand the key processes of the company. Rummler and Brache suggested a model for running a Process Improvement and Management project (PI&M), containing the following steps:
1. Identify the process to be improved (based on a critical business issue): The identification of key processes can be a formal or informal exercise. The management team might select processes by applying a set of criteria derived from strategic and tactical priorities, or process selection is based on obvious performance gaps. It is important is to select the process(es) which have the greatest impact on a competitive advantage or customer requirement.
2. Develop the objective(s) for the project based on the requirements of the process: The focus might be on quality improvement, productivity, cost, customer service or cycle time. The goal is however always the same; to get the key process under control.
3. Select the members of the cross-functional team: A horizontal (cross-functional) analysis is carried out by a team composed of representatives of all functions involved in the process. While a consultant or in-house staff person can do the job, the quality of the analysis and the commitment to change is far greater with a cross-functional team.
4. Document the current process by creating a flowchart or "organization map": Describe the process regarding the Organizational level, the Process level and the Job/ Performer level according to Rummler. Develop a cross-functional process map for the process.
5. Identify "disconnects" in the process: “Disconnections” are everything that inhibit the efficiency and effectiveness of the process. The identification should be categorized into the three levels: The Organizational level, the Process level and the Job/ Performer level.
6. Recommend changes (organizational, in the process or in its execution): Categorize and prioritize the main problems and possibilities, evaluate alternative solutions. Develop a cross-functional process map for the recommended process.
7. Establish process and sub-process measures: The process measures should reflect the objectives of the project.
8. Implement the improvements." [Business process improvement. Wikipedia]
The opportunity flow chart example "Replacing engine oil" was created using the ConceptDraw PRO diagramming and vector drawing software extended with the Cross-Functional Flowcharts solution from the Business Processes area of ConceptDraw Solution Park.
Opportunity flowchart

Cyber Security Degrees

HelpDesk
How to Draw a Gantt Chart Using ConceptDraw PRO

HelpDesk
How To Create a PERT Chart

HelpDesk
How to Create the New Library in ConceptDraw PRO

Network Security Architecture Diagram

HelpDesk
How To Create Risk Diagram (PDPC)
 sample")

Network Security Tips

- Recommend And Suggest Strategies They Can Use To Benefit From ...
- Recommend And Suggest Strategies They Can Use To Benefit From ...
- Process Flowchart | Recommend And Suggest Strategies They Can ...
- Plant Layout Plans | Type Of Floor Plan To Recommend For Storing ...
- Process Flowchart | Recommend And Suggest Strategies From ...
- Special Media Might Change Their Relationship And Behavior ...
- Recommended network architecture for BlackBerry SWS | Network ...
- How To Draw Basketball Court Recommend Byfiba
- Cloud Computing Diagrams | Introduction to Cloud Computing ...
- Cloud Computing Architecture Diagrams | Introduction to Cloud ...
- How to Design a Good Workflow | Work Flow Process Chart ...
- Cloud Computing Architecture Diagrams | Active Directory Diagram ...
- Cloud Computing Architecture Diagrams | Network Security ...
- How To use House Electrical Plan Software | Building Drawing ...
- Business Process Optimization | Optimize a Workflow | Business ...
- Opportunity flowchart - Template | Replacing engine oil - Opportunity ...
- Work Flow Process Chart | Create Workflow Diagram | Drawing ...
- Floor Plan | Make Your Own Floor Plans | Rail transport - Design ...
- Service 8 Ps fishbone diagram - Template | Fishbone Diagram | How ...
- Download and Install ConceptDraw Office on Mac | Downloading ...