This site uses cookies. By continuing to browse the ConceptDraw site you are agreeing to our Use of Site Cookies.

Basic Diagramming

Create flowcharts, org charts, shipping flowcharts, floor plans, business diagrams and more with ConceptDraw. Includes 1000s of professional-looking business templates that you can modify and make your own.

Purchase Process Flow Chart, Receiving Process Flow Chart, Accounting Flowchart Example.

The purchasing process follows very specific guidelines and includes a purchasing cycle flowchart and receiving process flow chart. Common key elements of purchasing process.
It is important to know how purchasing processes work and how each operation is done.

Why Flowchart Important to Accounting Information System?

The Accounting flowchart shows how information flows from source documents through the accounting records. The are based on the accounting procedures or processes.

Flowcharts are used to represent accounting information in a system . There are special symbols which are used to create accounting flowcharts. Try conceptdraw flowcharting set of symbols to draw a professional charts.
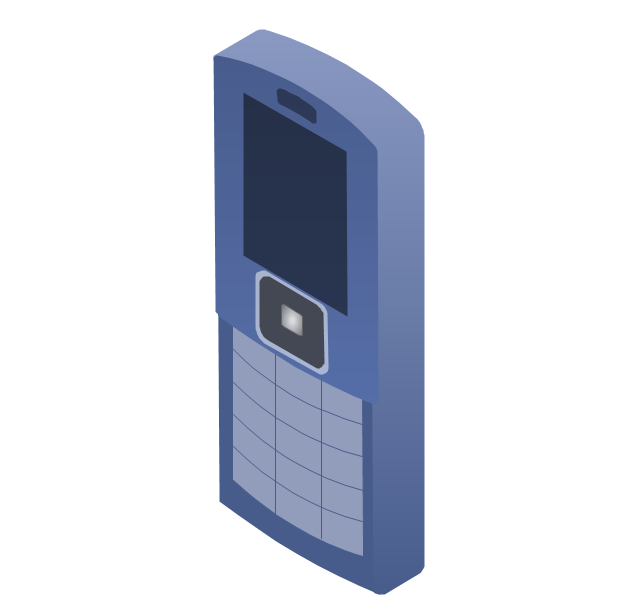
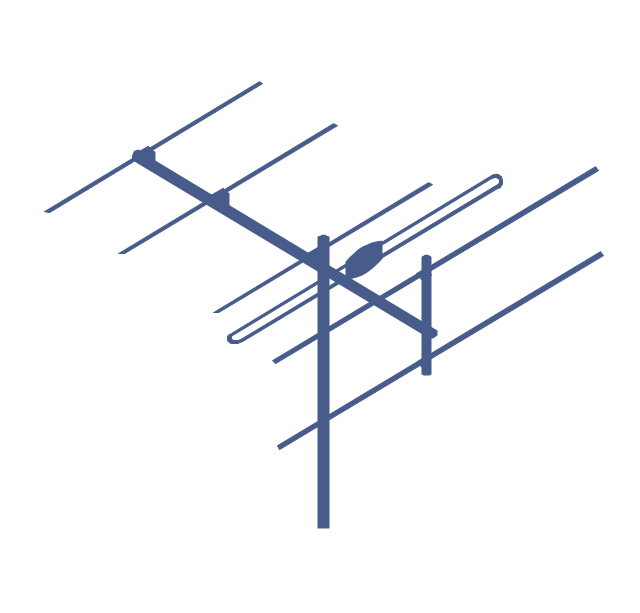
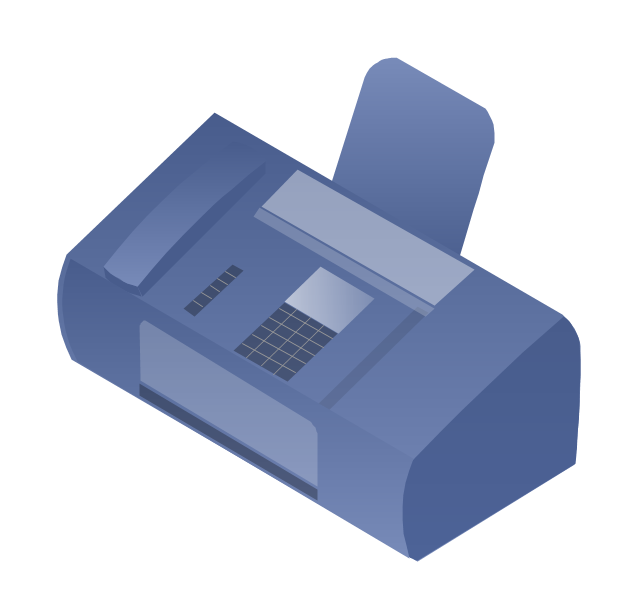
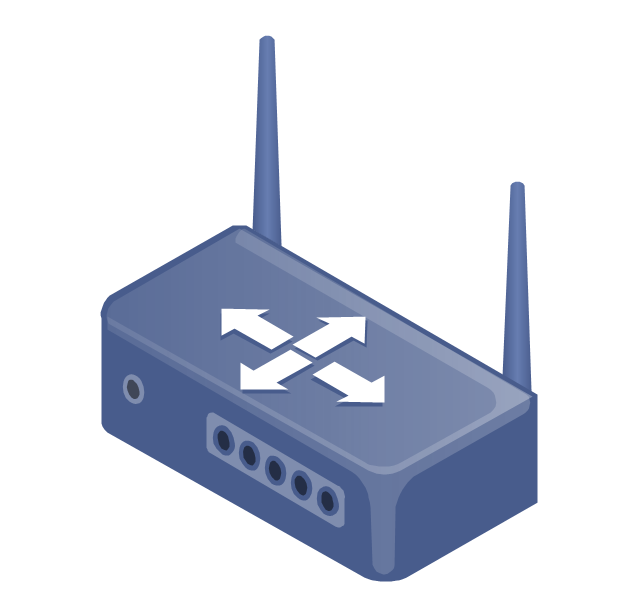
The vector stencils library "Telecommunication networks" contains 32 clipart images of telecommunication network devices and equipment for drawing telecom network diagrams.
"A telecommunications network is a collection of terminal nodes, links and any intermediate nodes which are connected so as to enable telecommunication between the terminals.
The transmission links connect the nodes together. The nodes use circuit switching, message switching or packet switching to pass the signal through the correct links and nodes to reach the correct destination terminal.
Each terminal in the network usually has a unique address so messages or connections can be routed to the correct recipients. The collection of addresses in the network is called the address space." [Telecommunications network. Wikipedia]
The clip art example "Telecommunication networks - Vector stencils library" was created using the ConceptDraw PRO diagramming and vector drawing software extended with the Telecommunication Network Diagrams solution from the Computer and Networks area of ConceptDraw Solution Park.
Internet
Internet, Internet, cloud,
Globe
Globe, globe, Internet,
Base station
Base station, base station,
Satellite dish
Satellite dish, satellite dish,
Satellite dish
Satellite dish, satellite dish,
Communications satellite
Communications satellite, satellite,
Wireless cell tower
Wireless cell tower,
Radio waves
Radio waves, radio waves,
Radio waves
Radio waves, radio waves,
Cellular phone
Cellular phone, cellular phone, mobile phone,
Server
Server, server,
Laptop computer
Laptop computer, laptop computer, notebook,
Desktop computer
Desktop computer, PC,
Car
Car, car,
Satellite truck
Satellite truck, in-vehicle station,
House
House, house,
House
House, house,
Office building
Office building, office building,
Mountain
Mountain, mountain,
Tree
Tree, tree,
Tree
Tree, fir-tree, tree,
User
User, man, user,
Call-center
Call-center, call-center, call operator, woman,
Multi-storey
Multi-storey, building,
Antenna
Antenna, antenna,
Router
Router, router,
IP phone
IP phone, IP phone,
Fax
Fax, fax,
Network cell
Network cell, network cell, cell, honeycomb,
IP Camera
IP Camera, camera,
Wireless router
Wireless router, wireless router,
Networking device
Networking device, device,

How to Create Flowcharts for an Accounting Information System

Accounting information is a system of processes to represent financial and accounting data that is used by decision makers. To represent accounting processes there are special symbols which are used to create accounting flowcharts.
Flowcharts help users of Accounting Information System to understand the step sequences of accounting processes. Use ConceptDraw PRO with Accounting Flowcharts solution to document and communicate visually how accounting processes work, and how each operation is done.

Data Flow Diagram

Data flow diagram (DFD) is the part of the SSADM method (Structured Systems Analysis and Design Methodology), intended for analysis and information systems projection. Data flow diagrams are intended for graphical representation of data flows in the information system and for analysis of data processing during the structural projection. Data flow diagram often used in connection with human process and can be displayed as workflow diagram. The critical Process Flow Diagram is another flowchart technique for designing data flow in connection with organizational processes. The critical Process flow diagram may use different range of symbols than a classic workflow diagram.

Flow chart Example. Warehouse Flowchart

Warehouse Flowcharts are different diagrams describing wharehousing and inventory menagement processes. Typical purposes of warehouse flowcharts are evaluating warehouse performance and organizational performance, measuring efficiency of customer service. This type of workflow diagrams can be used for identifying any disconnection between business activities and business objectives.
Standard warehousing process flow diagram and standard workflow diagram used for process identification for further evaluating effectiveness and profitability of overall business process. Use the ConceptDraw PRO diagramming and vector drawing software extended with the Flowcharts solution from the Diagrams area of ConceptDraw Solution Park to design your own workflow diagrams, process flow diagram and flow charts. Need to use Process Flow Diagram for designing Warehouse packages flow.
ConceptDraw Arrows10 Technology

Bus Network Topology

The Computer and Networks solution from Computer and Networks area of ConceptDraw Solution Park provides examples, templates and vector stencils library with symbols of local area network (LAN) and wireless LAN (WLAN) equipment.
Use it to draw the physical and logical network topology diagrams for wired and wireless computer communication networks.
Create your bus network topology diagrams using the ConceptDraw PRO.

Flowchart design. Flowchart symbols, shapes, stencils and icons

A flowchart is a type of diagram that represents an algorithm, workflow or process, showing the steps as boxes of various kinds - flowchart symbols, and their order by connecting them with arrows.
Mavericks have always desired to stand apart and gorgeous design is the recipe for that. Any business graphic document will be more understandable if will use an expository color scheme for their parts. Flowchart design makes versatile presenting and explaining of the process and gives a fresh view that distinguishes it from black and white flowcharts on a paper. Workflow diagram or process flow diagrams become more understandable to ordinary people when it use minimum symbols and special signs.
The best design can be accomplished by starting from any of the suitable Conceptdraw examples. Pick one of them and begin to input proper text into each Flowchart symbols and shapes. Apply less colors in the document and don't turn into rainbow your diagram, three or four will be enough, also note that business process flowchart may not contain bright color hues. The next clue is to use identical colors for same flowchart shape types.
Business Process Modeling with ConceptDraw
Business Process Modeling with ConceptDraw "Business Process Diagrams" Solution

Process Flowchart

ConceptDraw is Professional business process mapping software for making process flow diagram, workflow diagram, general flowcharts and technical illustrations for business documents. It is includes rich examples, templates, process flowchart symbols. ConceptDraw flowchart maker allows you to easier create a process flowchart. Use a variety of drawing tools, smart connectors, flowchart symbols and shape libraries to create flowcharts of complex processes, process flow diagrams, procedures and information exchange.
How To Create a Process Flow Chart (business process modelling techniques)