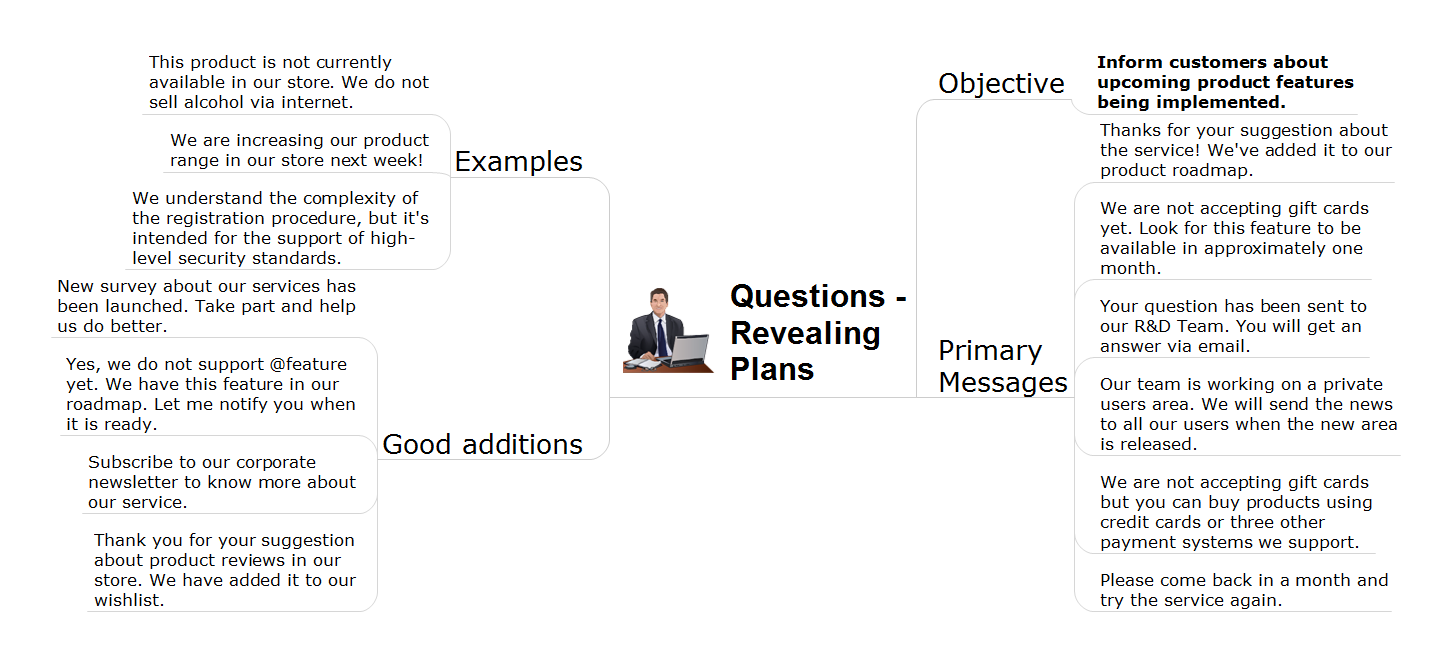
Create Response Charts

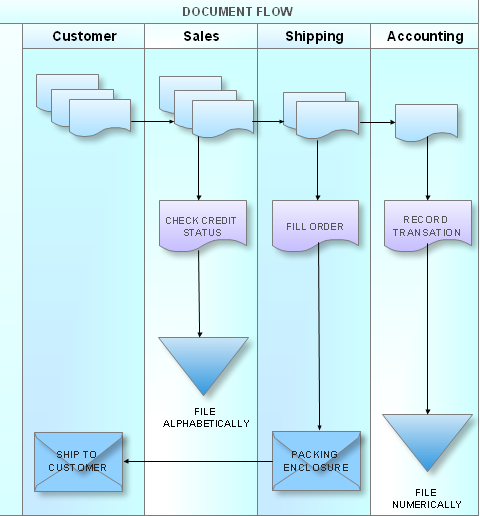
What is a Cross Functional Flow Chart?
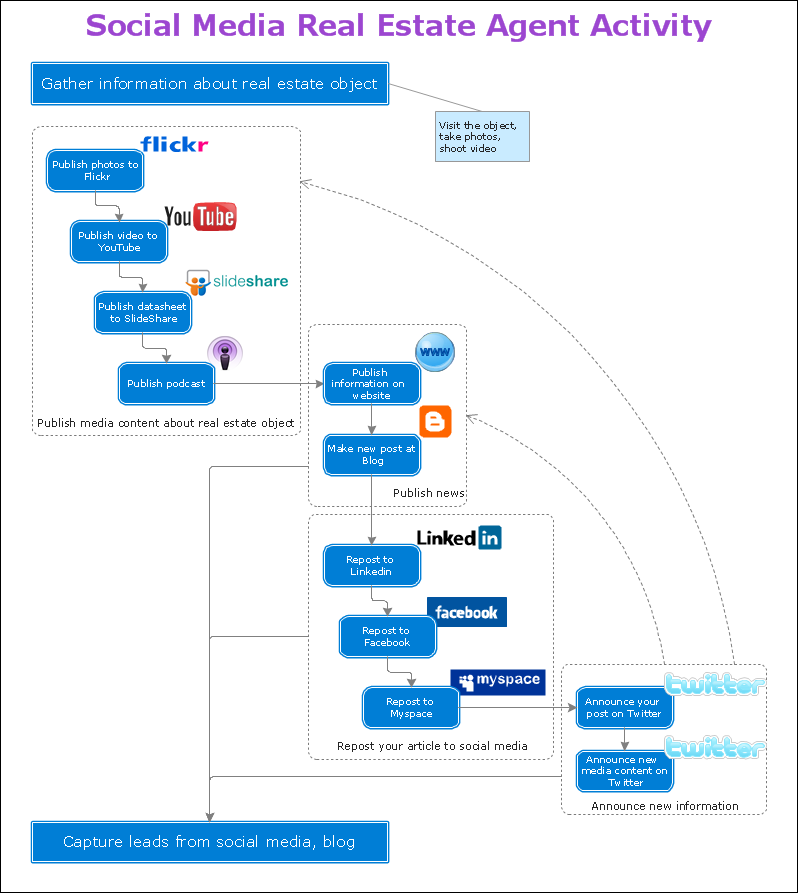
Organizing and Selecting Social Media Response Action
Social Media Response Management DFD Charts - software tools


What is Interactive Flowcharts

Provide Team Training
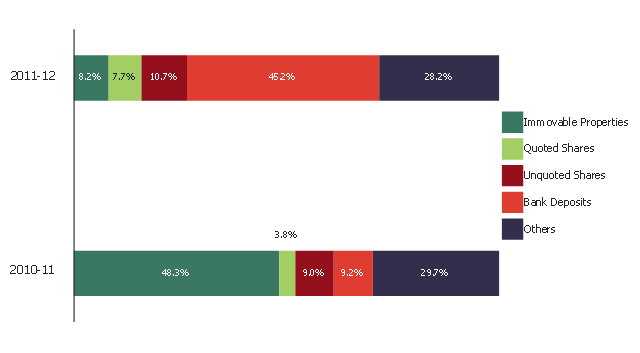
This divided bar diagram sample shows the compisition of estates in 2010-11 and 2011-12. It was created on the base of the figure "Composition of estates" from the website of the Inland Revenue Department of the Government of the Hong Kong Special Administrative Region.
[ird.gov.hk/ dar/ 2011-12/ en/ assessing.html]
"An estate is the net worth of a person at any point in time alive or dead. It is the sum of a person's assets - legal rights, interests and entitlements to property of any kind - less all liabilities at that time. The issue is of special legal significance on a question of bankruptcy and death of the person.
Depending on the particular context, the term is also used in reference to an estate in land or of a particular kind of property (such as real estate or personal estate). The term is also used to refer to the sum of a person's assets only." [Estate (law). Wikipedia]
The example "Composition of estates" was created using the ConceptDraw PRO diagramming and vector drawing software extended with the Divided Bar Diagrams solution from the Graphs and Charts area of ConceptDraw Solution Park.
Divided bar chart
Line Chart Examples

Best Program to Create a Fowchart

Business Diagram Software


- Real Estate Process Flow Chart
- Example Of Organizational Chart For Real Estate Company
- Flow Chart Digram Of Real Estate
- Real Estate Broker Flow Chart
- Real Estate Marketing
- Production Flow Chart For A Real Estate
- Data Flow Diagrams For Real Estate Management
- Flow Chart For Real Estate Project
- Real Estate Admin Process Flow Chart
- What is a Cross Functional Flow Chart ? | It Flow Chart For Estate ...