Fault Tree Diagram

This example was redesigned from the Wikimedia Commons file: Example of High Level Fault Tree.jpg. [commons.wikimedia.org/ wiki/ File:Example_ of_ High_ Level_ Fault_ Tree.jpg]
"Risk assessment is the determination of quantitative or qualitative value of risk related to a concrete situation and a recognized threat (also called hazard). Quantitative risk assessment requires calculations of two components of risk (R):, the magnitude of the potential loss (L), and the probability (p) that the loss will occur. Acceptable risk is a risk that is understood and tolerated usually because the cost or difficulty of implementing an effective countermeasure for the associated vulnerability exceeds the expectation of loss.
In all types of engineering of complex systems sophisticated risk assessments are often made within Safety engineering and Reliability engineering when it concerns threats to life, environment or machine functioning. The nuclear, aerospace, oil, rail and military industries have a long history of dealing with risk assessment. Also, medical, hospital, social service and food industries control risks and perform risk assessments on a continual basis. Methods for assessment of risk may differ between industries and whether it pertains to general financial decisions or environmental, ecological, or public health risk assessment." [Risk assessment. Wikipedia]
The FTA diagram example "High level fault tree" was created using the ConceptDraw PRO diagramming and vector drawing software extended with the Fault Tree Analysis Diagrams solution from the Engineering area of ConceptDraw Solution Park.
FTA diagram

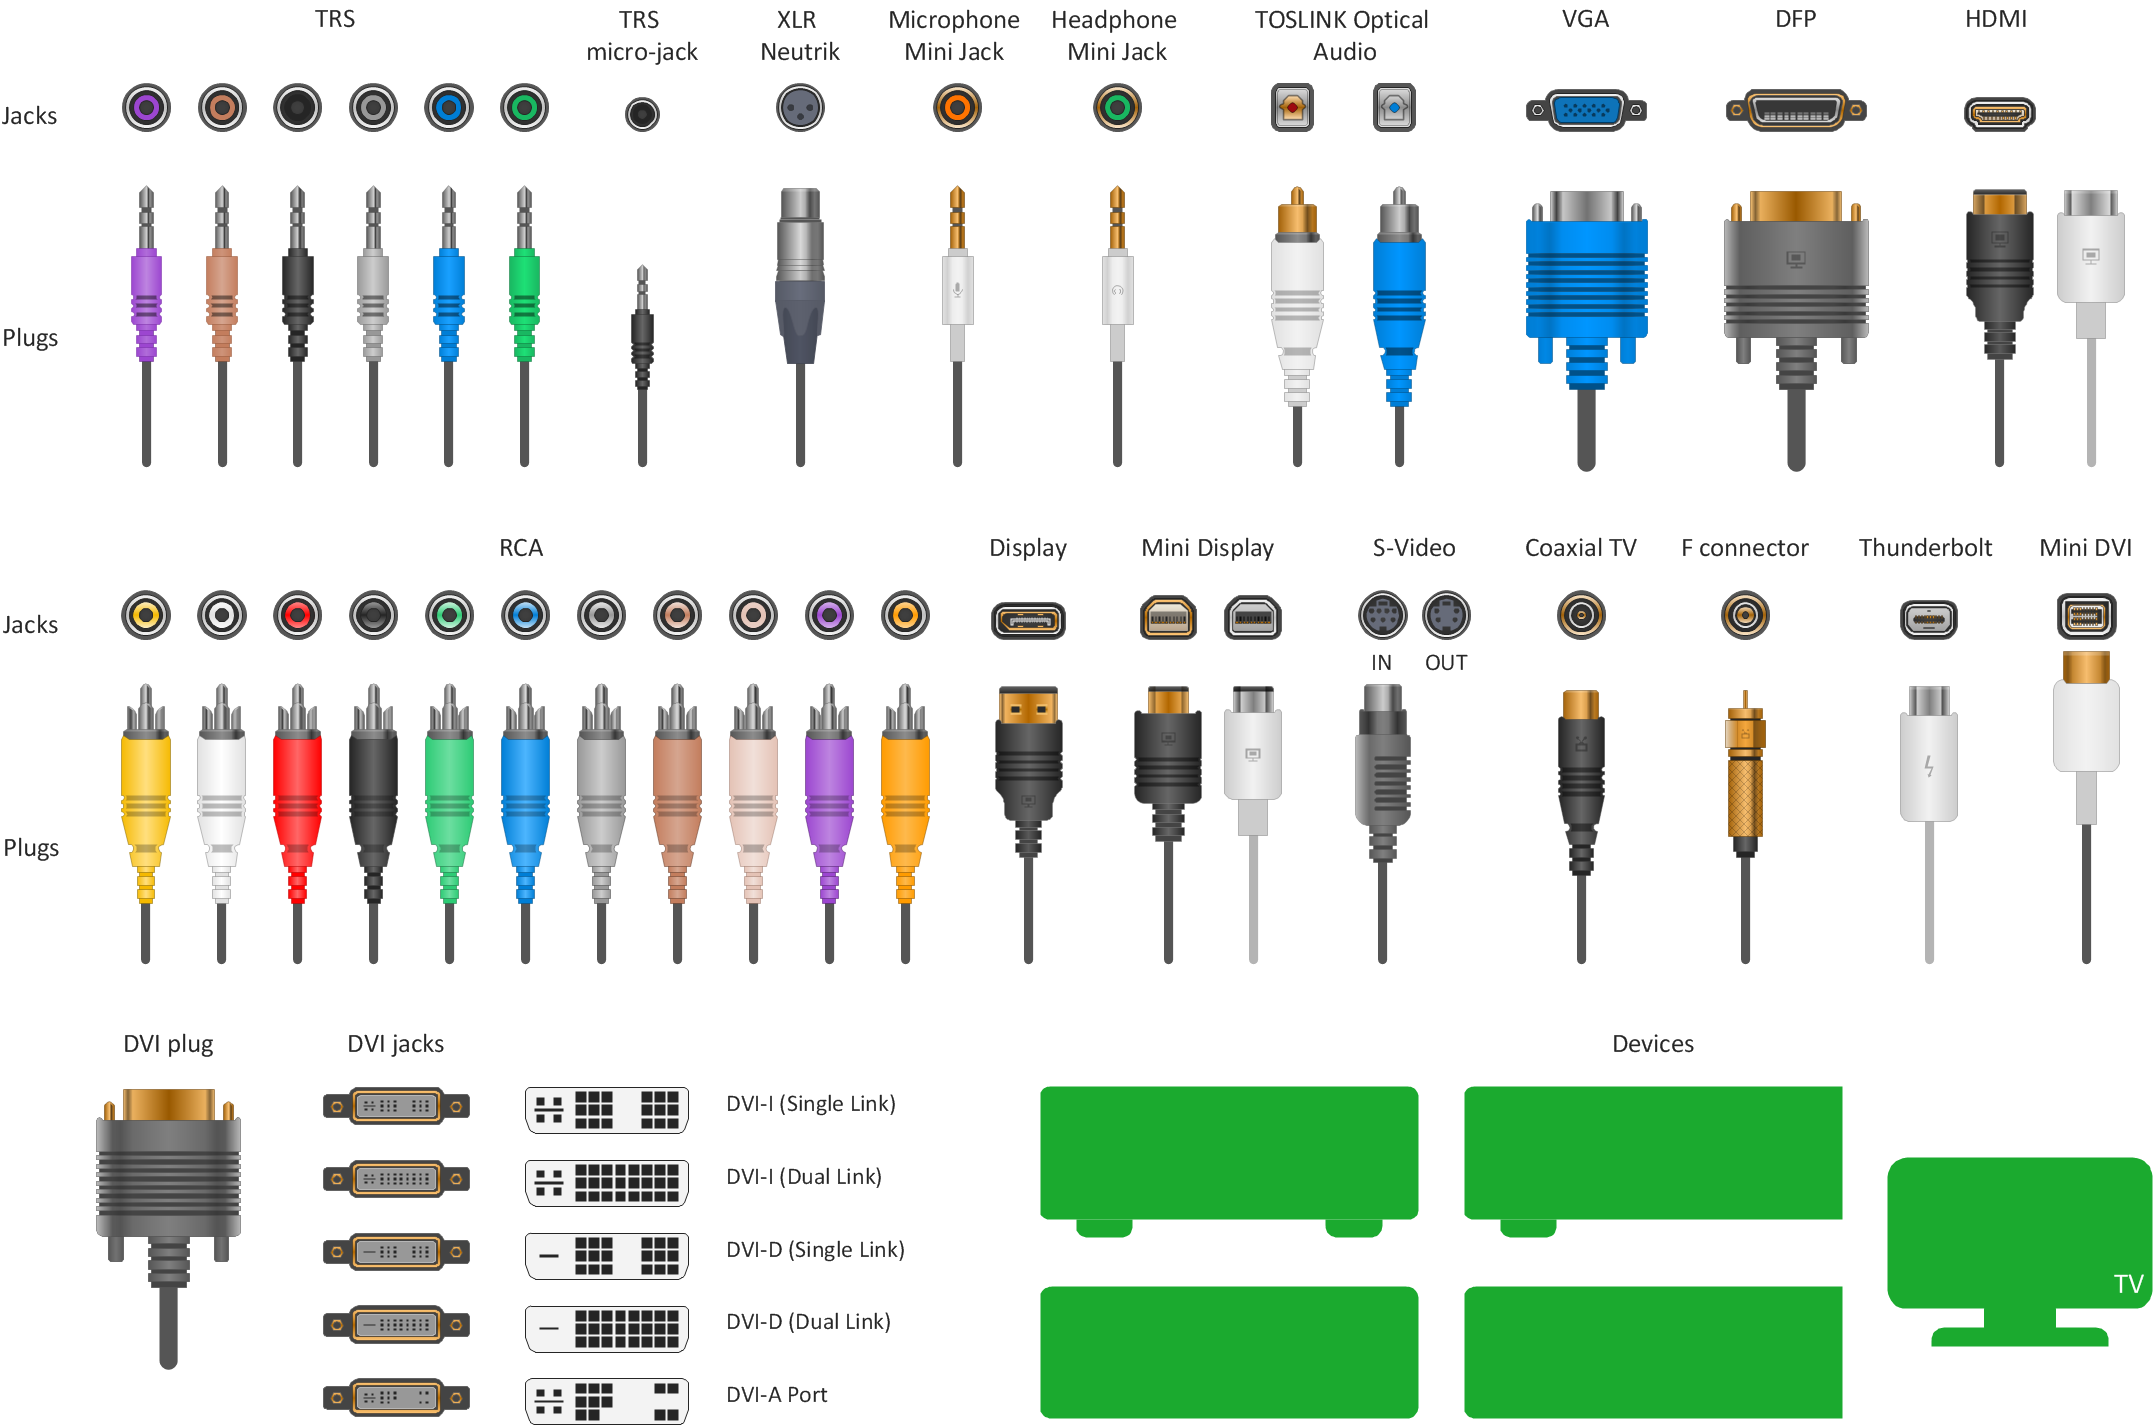
How to Make Audio and Video Connections
 Meter Dashboard
Meter dashboard solution extends ConceptDraw DIAGRAM software with templates, samples and vector stencils library with meter indicators for drawing visual dashboards showing quantitative data.
 Histograms
How to make a Histogram? Making a Histogram is an incredibly easy process when it is done with ConceptDraw DIAGRAM. The Histograms Solution enhances ConceptDraw DIAGRAM functionality with extensive drawing tools, numerous samples, and examples; also a quick-start template and library of ready vector stencils for visualization the data and professional drawing Histograms.
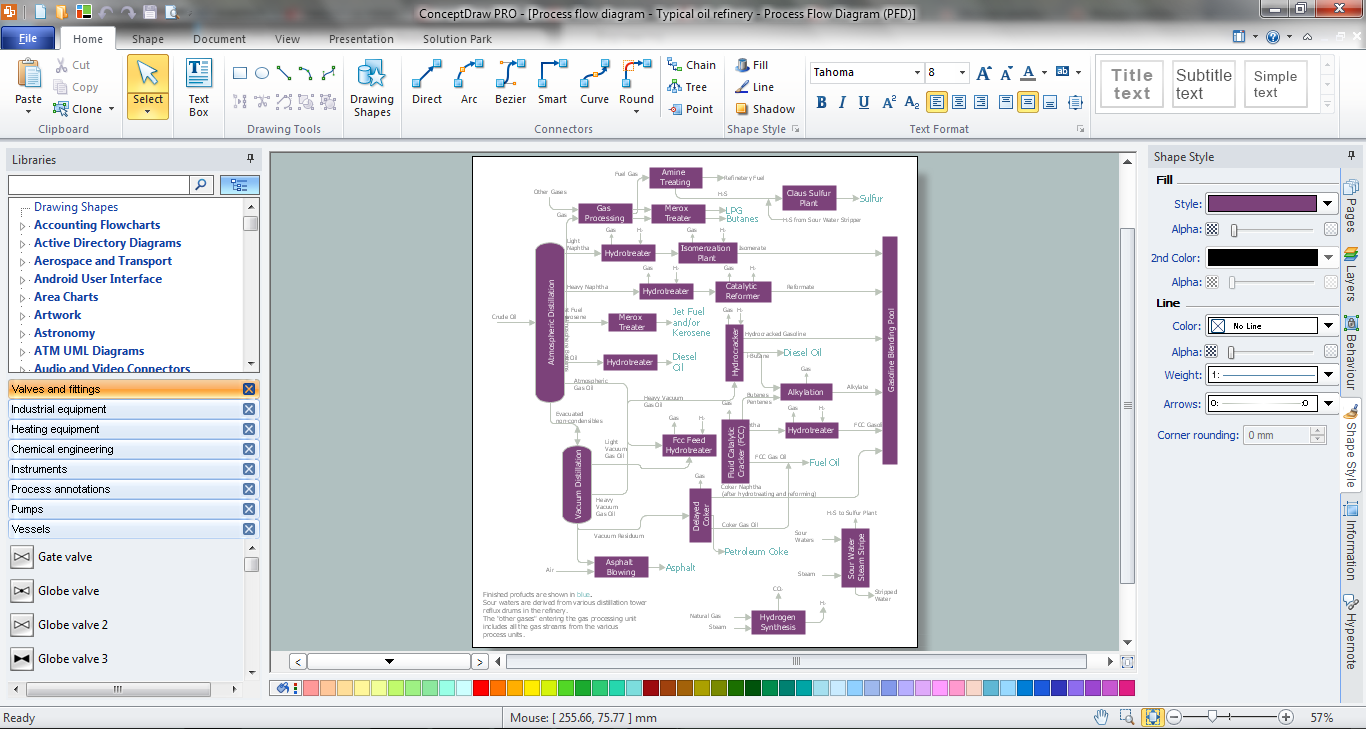
Process Engineering
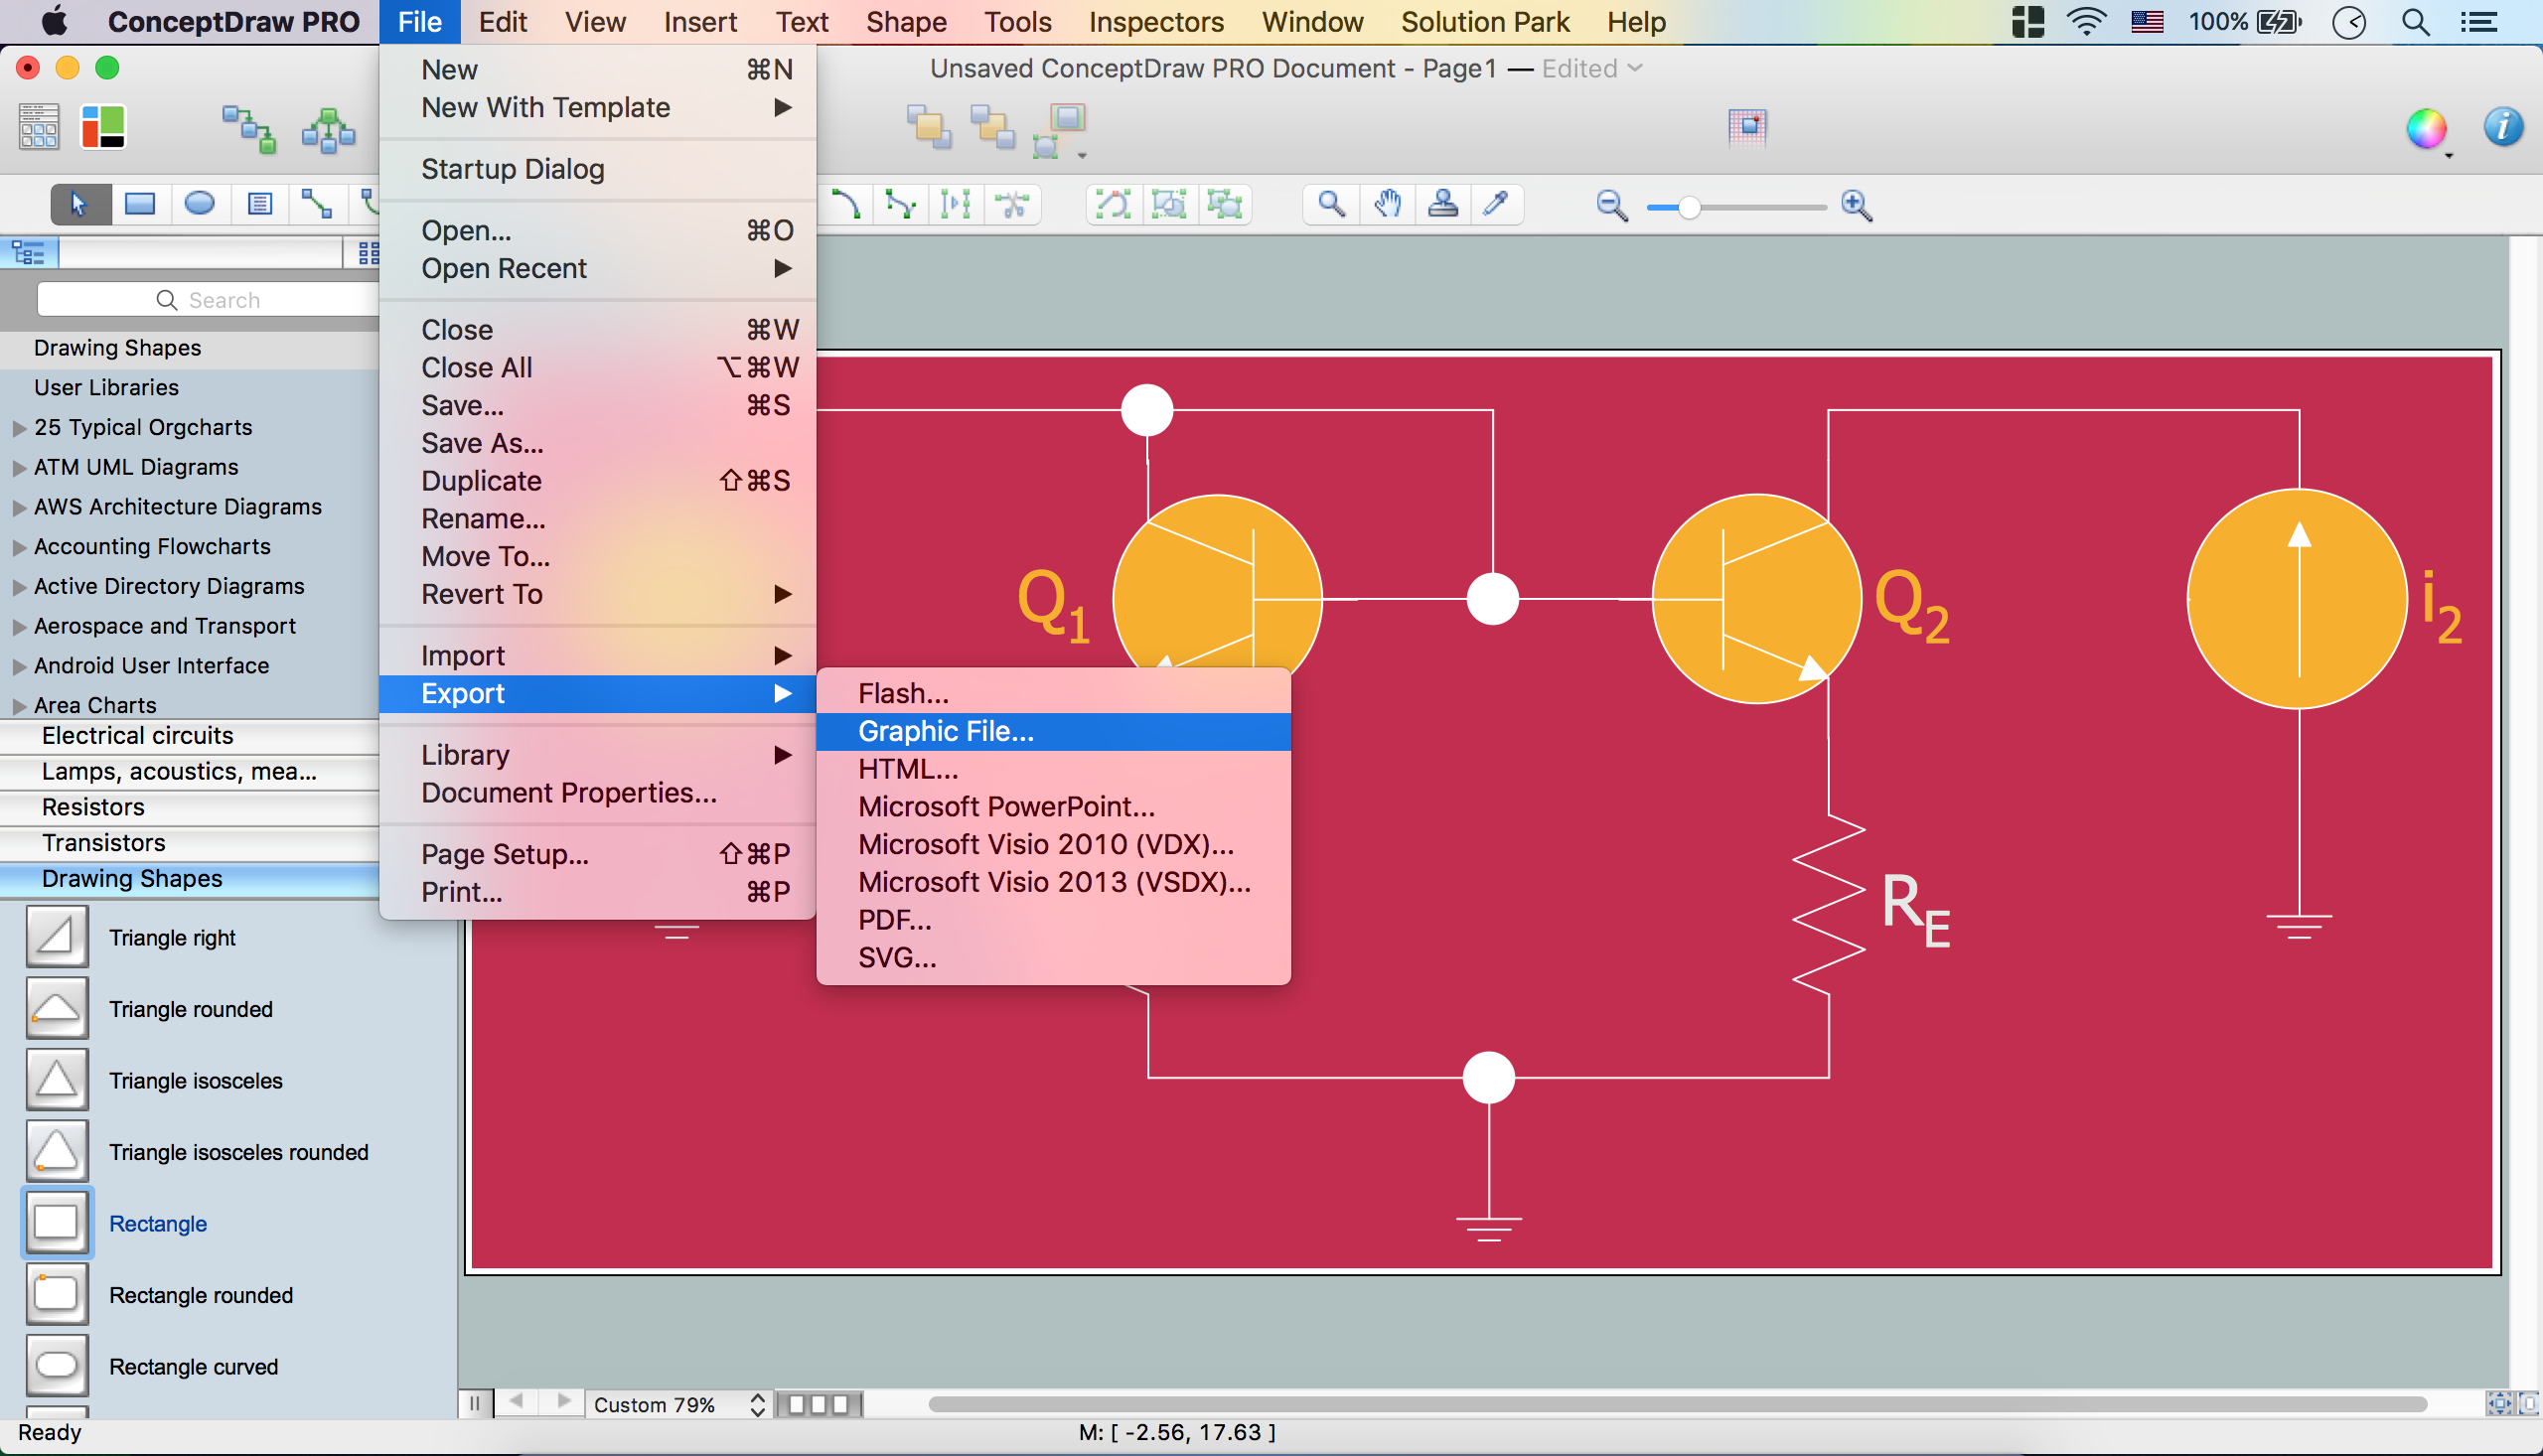
Electrical Diagram Software

 Spatial Dashboard
Spatial dashboard solution extends ConceptDraw DIAGRAM software with templates, samples and vector stencils libraries with thematic maps for drawing visual dashboards showing spatial data.
 Line Graphs
How to draw a Line Graph with ease? The Line Graphs solution extends the capabilities of ConceptDraw DIAGRAM with professionally designed templates, samples, and a library of vector stencils for drawing perfect Line Graphs.
 Area Charts
Area Charts are used to display the cumulative totals over time using numbers or percentages; or to show trends over time among related attributes. The Area Chart is effective when comparing two or more quantities. Each series of data is typically represented with a different color, the use of color transparency in an object’s transparency shows overlapped areas and smaller areas hidden behind larger areas.
 Correlation Dashboard
Correlation dashboard solution extends ConceptDraw DIAGRAM software with samples, templates and vector stencils library with Scatter Plot Charts for drawing the visual dashboard visualizing data correlation.
 Infographics Area
Solutions of the area What is Infographics from ConceptDraw Solution Park collect templates, samples and vector stencils libraries with design elements for the drawing information graphics.
 Continent Maps
Continent Maps solution extends ConceptDraw DIAGRAM software with templates, samples and libraries of vector stencils for drawing the thematic maps of continents, state maps of USA and Australia.
 Status Dashboard
Status dashboard solution extends ConceptDraw DIAGRAM software with templates, samples and vector stencils libraries with graphic indicators for drawing the visual dashboards showing status data.
 Germany Map
The Germany Map solution contains collection of samples, templates and scalable vector stencil graphic maps, representing map of Germany and all 16 states of Germany. Use the Germany Map solution from ConceptDraw Solution Park as the base for various them
- Accident analytic tree - FTA diagram | FTA diagram - Hazard ...
- FTA diagram - Hazard analysis | Design elements - Fault tree ...
- FTA diagram - Hazard analysis | High level fault tree | Fault Tree ...
- Design elements - Fault tree analysis diagrams | Fault Tree Analysis ...
- Fault Tree Analysis Diagrams | Design elements - Fault tree analysis ...
- Fault Tree Analysis Examples And Solutions
- Fault Tree Analysis Diagrams | High level fault tree | How to Design ...
- Fault Tree Analysis Diagrams | High level fault tree | How to Design ...
- Fault Tree Analysis Excel Template
- Loss Tree Analysis Example
- Event Tree Analysis Of Hospital
- Fault Tree Analysis Software | High level fault tree | Wiring Diagrams ...
- Safety Fault Tree Analysis Example
- Fault Tree Analysis Diagrams | Context Diagram Template | Root ...
- Fault Tree Analysis Software | High level fault tree | Design elements ...
- Fault Tree Analysis Industrial Example
- Fault Tree Analysis Diagrams | Process Flowchart | High level fault ...
- Engineering Fault Tree Analysis Diagrams
- CORRECTIVE ACTIONS PLANNING. Risk Diagram (PDPC) | High ...
- Design elements - Fault tree analysis diagrams | Audit failure - Fault ...