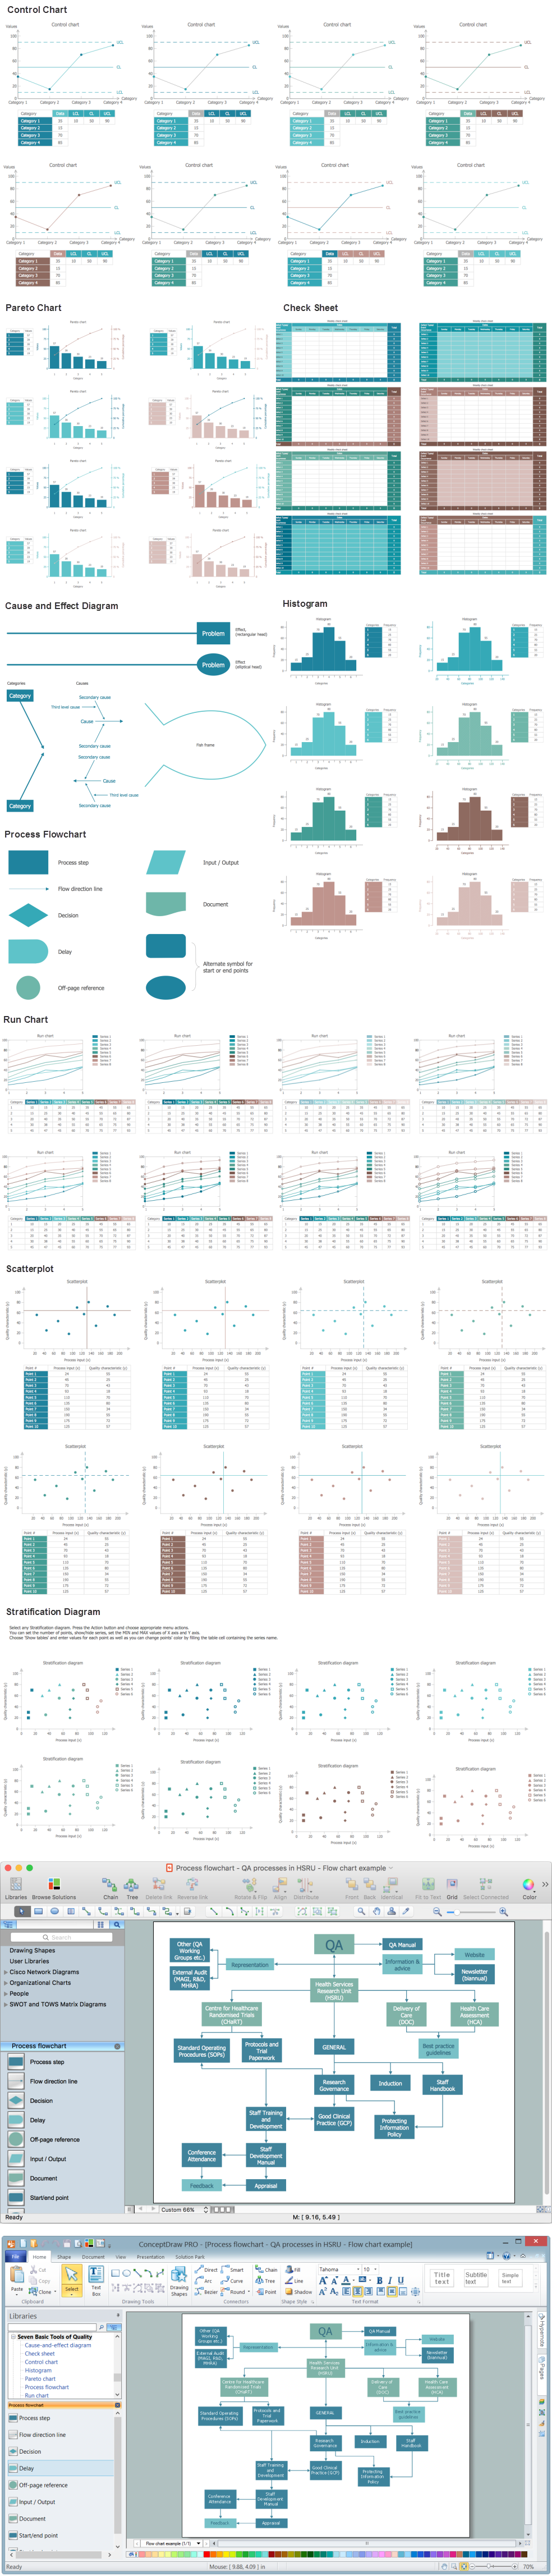
 Seven Basic Tools of Quality
Manage quality control in the workplace, using fishbone diagrams, flowcharts, Pareto charts and histograms, provided by the Seven Basic Tools of Quality solution.
Seven Basic Tools of Quality — Quality Control

Seven Basic Tools of Quality - Histogram

Quality Management Tools
-Diagram-in-SolutionBrowser.png)
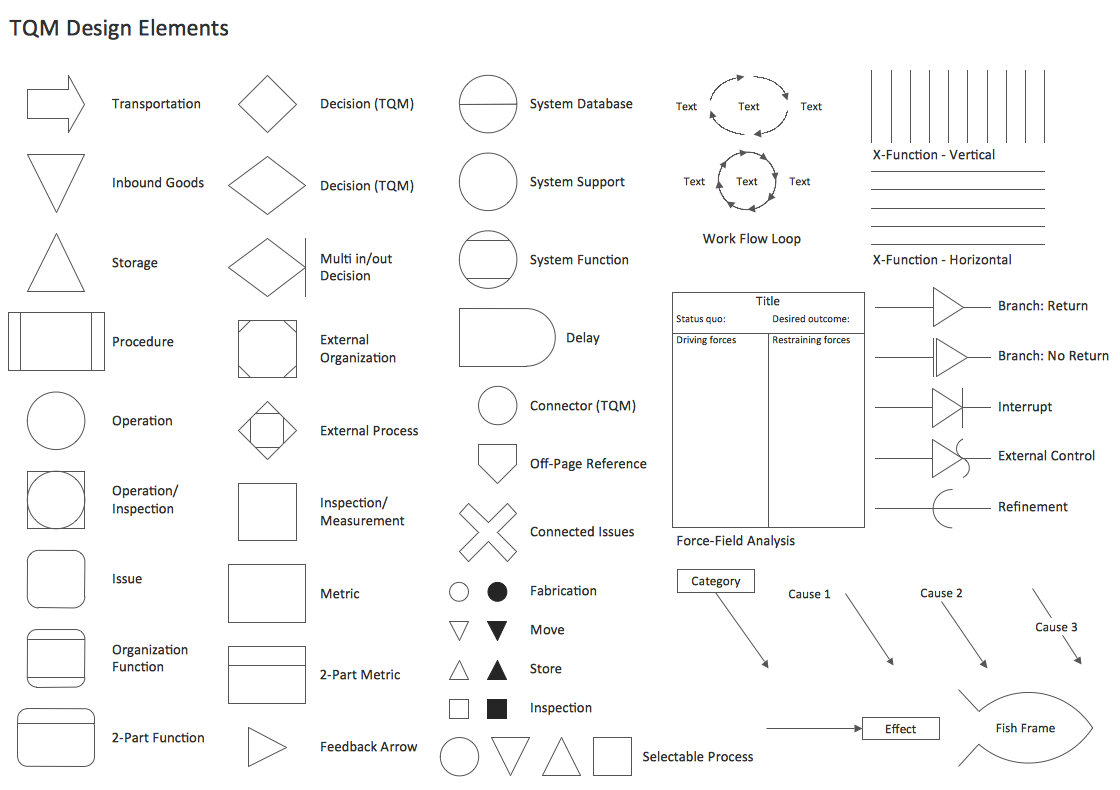
TQM Tools
Seven Basic Tools of Quality - Fishbone Diagram

Seven Basic Tools of Quality - Flow Chart
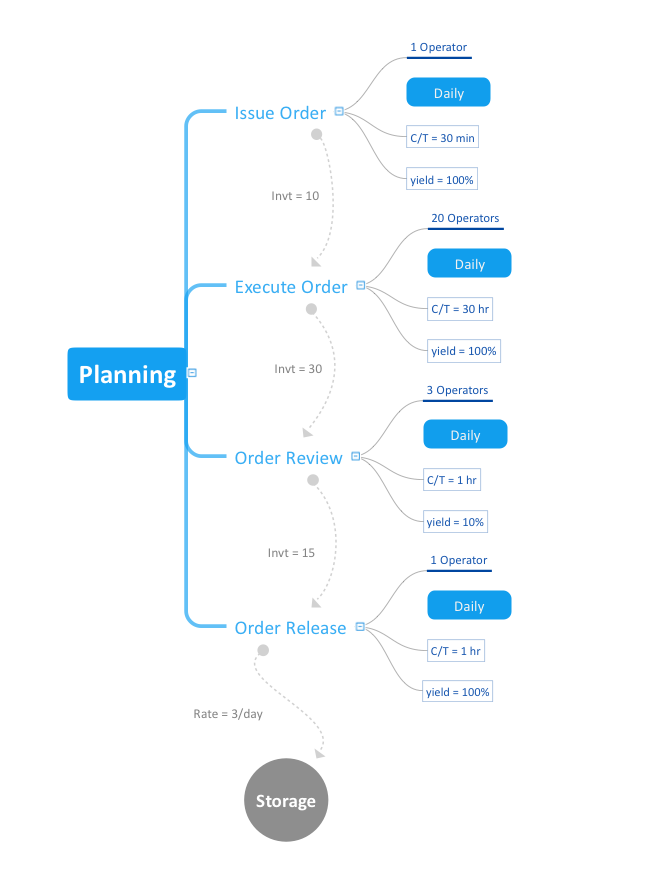
Mind Mapping in the Quality Management
Probability Quality Control Tools

- Seven Basic Tools of Quality | 7 Tools For Quality Example
- Seven Basic Tools of Quality | Basic 7 Qc Tools With Examples
- Seven Basic Tools of Quality | Stratification diagram example ...
- Seven Basic Tools of Quality | 7 Tqm Tools With Example Of The ...
- Seven Basic Tools of Quality - Quality Control | 7qc Tools With ...
- 7 New Management Tools Examples
- Probability Quality Control Tools | Organizational Structure Total ...
- Tqm Flowchart Example
- TQM Diagram Example | Process Flowchart | Quality Control Chart ...
- Seven Basic Tools of Quality — Quality Control | Seven Basic Tools ...