Pyramid Diagram

"The Time/ Money/ Quality Triangle illustrates an advertising truism, that "you can't have all three." If there is little time or money, then ad quality will suffer. The more time and/ or money that is available to the project, the higher the quality can be. However, the level of quality must be appropriate to the product...not all products should have high-quality ads!" [Advertising/ Strategies. Wikibooks]
This triangular diagram example was redesigned using the ConceptDraw PRO diagramming and vector drawing software from Wikimedia Commons file Time-Quality-Money.png. [commons.wikimedia.org/ wiki/ File:Time-Quality-Money.png]
This file is licensed under the Creative Commons Attribution-Share Alike 3.0 Unported license. [creativecommons.org/ licenses/ by-sa/ 3.0/ deed.en]
The chart sample "Time, quality, money triangle diagram" is included in the Pyramid Diagrams solution from the Marketing area of ConceptDraw Solution Park.
Triangular chart

Quality Management Tools
-Diagram-in-SolutionBrowser.png "Quality Management Tools")
Seven Basic Tools of Quality - Histogram

Quality Management System

Quality Control Chart Software — ISO Flowcharting

Seven Basic Tools of Quality — Quality Control

Total Quality Management

House of Quality Matrix Software

Cisco Network Templates


Probability Quality Control Tools

TQM Software

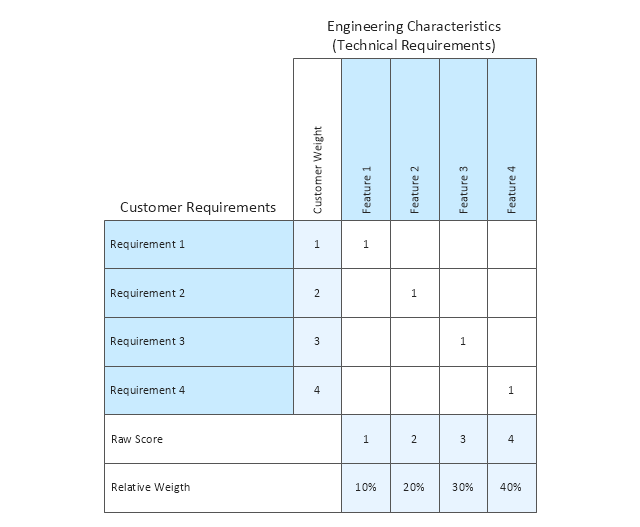
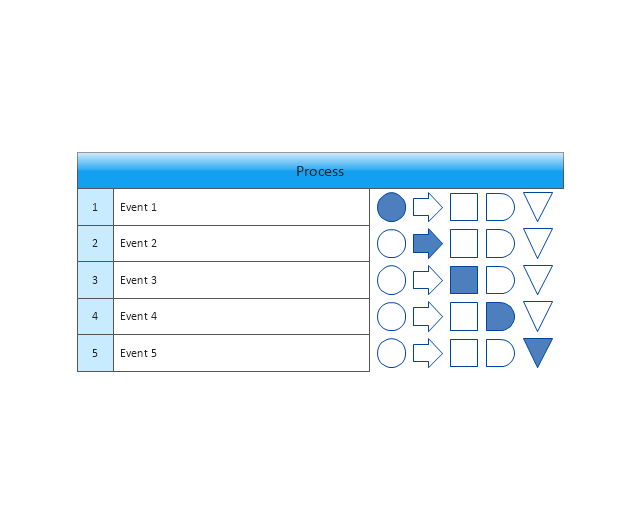
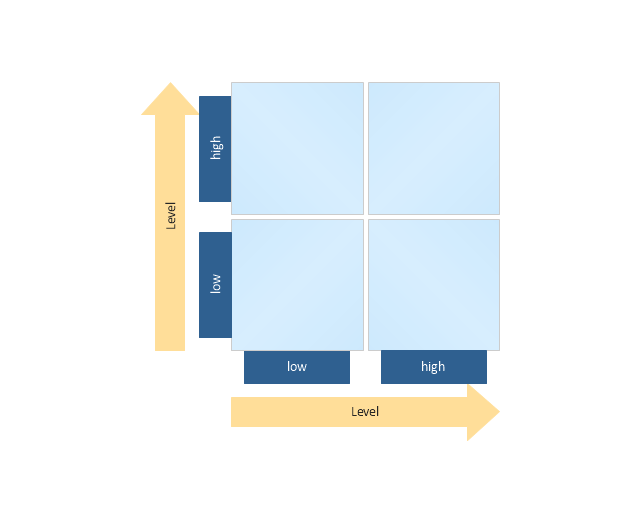
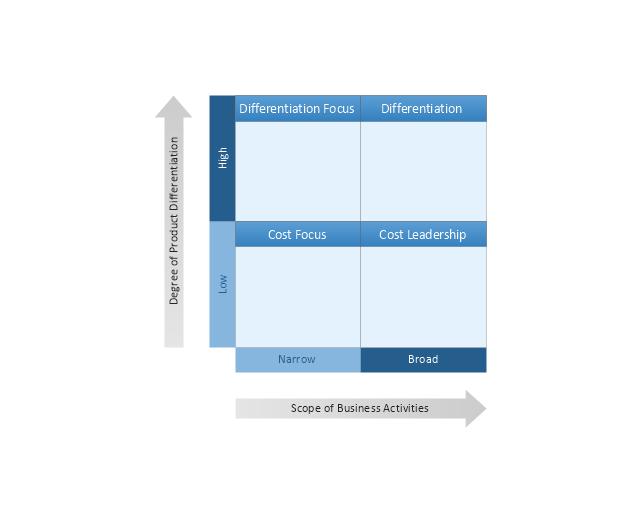
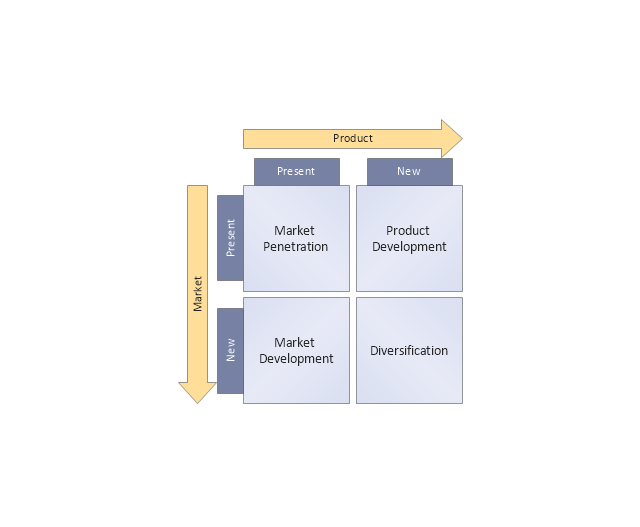
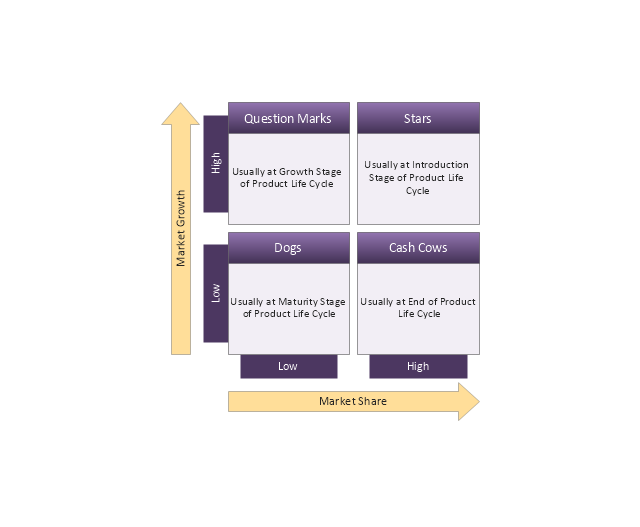
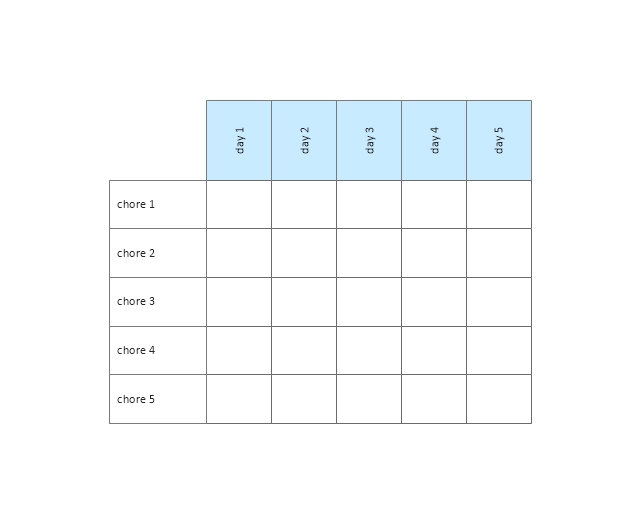
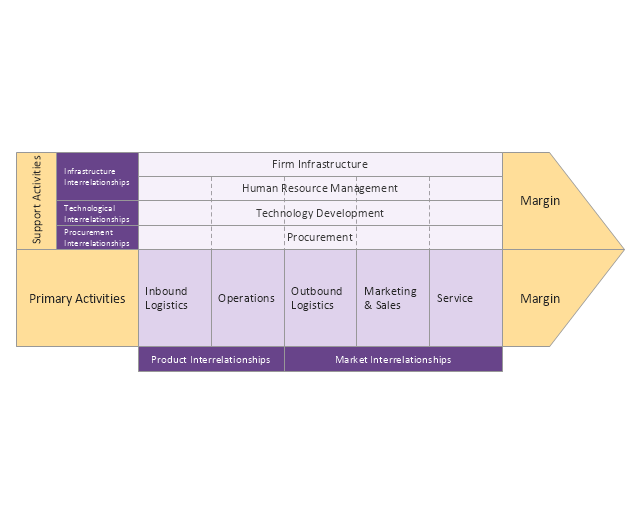
The vector stencils library "Matrices" contains 10 templates of marketing matrix diagrams and charts.
Use these templates to create your marketing matrices in the ConceptDraw PRO diagramming and vector drawing software extended with the Matrices solution from the Marketing area of ConceptDraw Solution Park.
Use these templates to create your marketing matrices in the ConceptDraw PRO diagramming and vector drawing software extended with the Matrices solution from the Marketing area of ConceptDraw Solution Park.
Quality function deployment matrix
Flow process chart
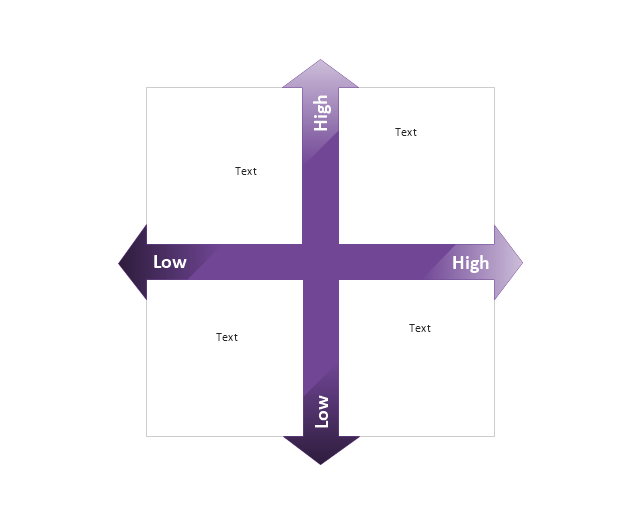
Four-quadrant matrix
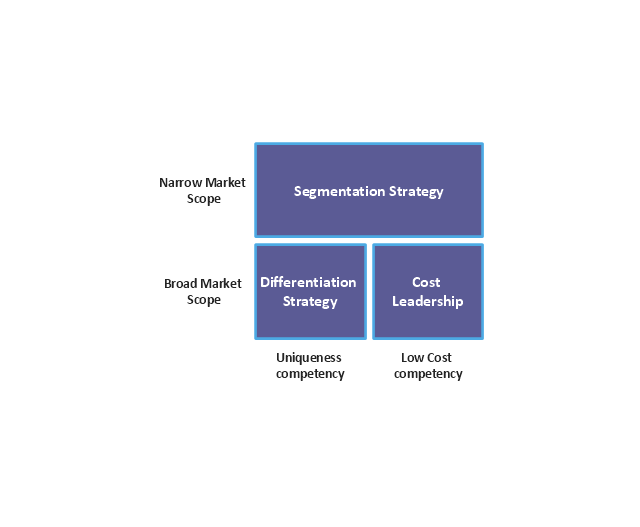
Competitive strategies matrix
Ansoff matrix
BCG matrix
Chore chart
Porter's value chain diagram
Positioning map
Porter's generic strategies matrix
Process Flowchart


The vector stencils library "Workflow diagrams" contains 54 symbol icons of workflow diagrams.
The workflow diagrams represent information flow, automation of business processes, business process re-engineering, accounting, management, and human resources tasks in industry, business, and manufacturing.
Use this library to draw workflow diagrams in the ConceptDraw PRO diagramming and vector drawing software extended with the Workflow Diagrams solution from the Business Processes area of ConceptDraw Solution Park.
www.conceptdraw.com/ solution-park/ business-process-workflow-diagrams
Accounting

Accounts Payable

Accounts Receivable

Bank

Board of Directors

Copy Center

Customer Service

Distribution

Finance

Information Systems

International Division

International Marketing

International Sales

Inventory

Legal Department

Mailroom 2

Mailroom 1

Management

Manufacturing

Marketing

Motor Pool

Packaging

Payroll

Person 1

Person 2

Personnel/ Staff

Publications

Purchasing

Quality Assurance

Exchange

Reception

Research and Development

Sale contract

Shipping

Suppliers

Telecommunications

Treasurer

Warehouse

Lorry

Quality

Production

Box

Boxes

Open box

Payment

Receiving

Sales

Phone

Operator 1

Online booking

Operator 2

Server

Car

Mini truck

- Money Vector Png
- Png Money Vector
- Uni Directional Approach Vector Icon Png
- Pyramid Diagram | Time - Vector stencils library | Time, quality ...
- Vector The Time Png
- Money Png Vector
- Food Supplier Vehicle Vector Png
- Currency - Vector stencils library | Pyramid Diagram | Time, quality ...
- Business people - Vector stencils library | Business People Clipart ...
- Time Vector Image Png
- Investment Vector Png
- Exchange Money Png Vector
- House Vector Illustration Png
- Keep The Environment Vector Png
- Types of Flowcharts | Map symbols - Vector stencils library | Seven ...
- ADS Png
- Quality Management System | Business people - Vector stencils ...
- Investment Png Vector
- Pyramid Diagram | Decision Making | Helpful in all stages of quality ...
- Business feedback loop | Helpful in all stages of quality ...