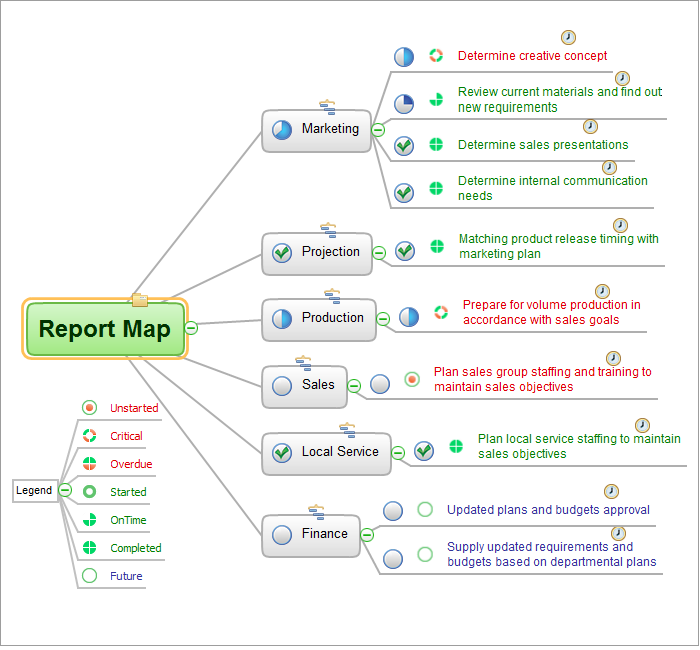
One formula of professional mind mapping : input data + output data + make great presentation
Entity Relationship Diagram Examples


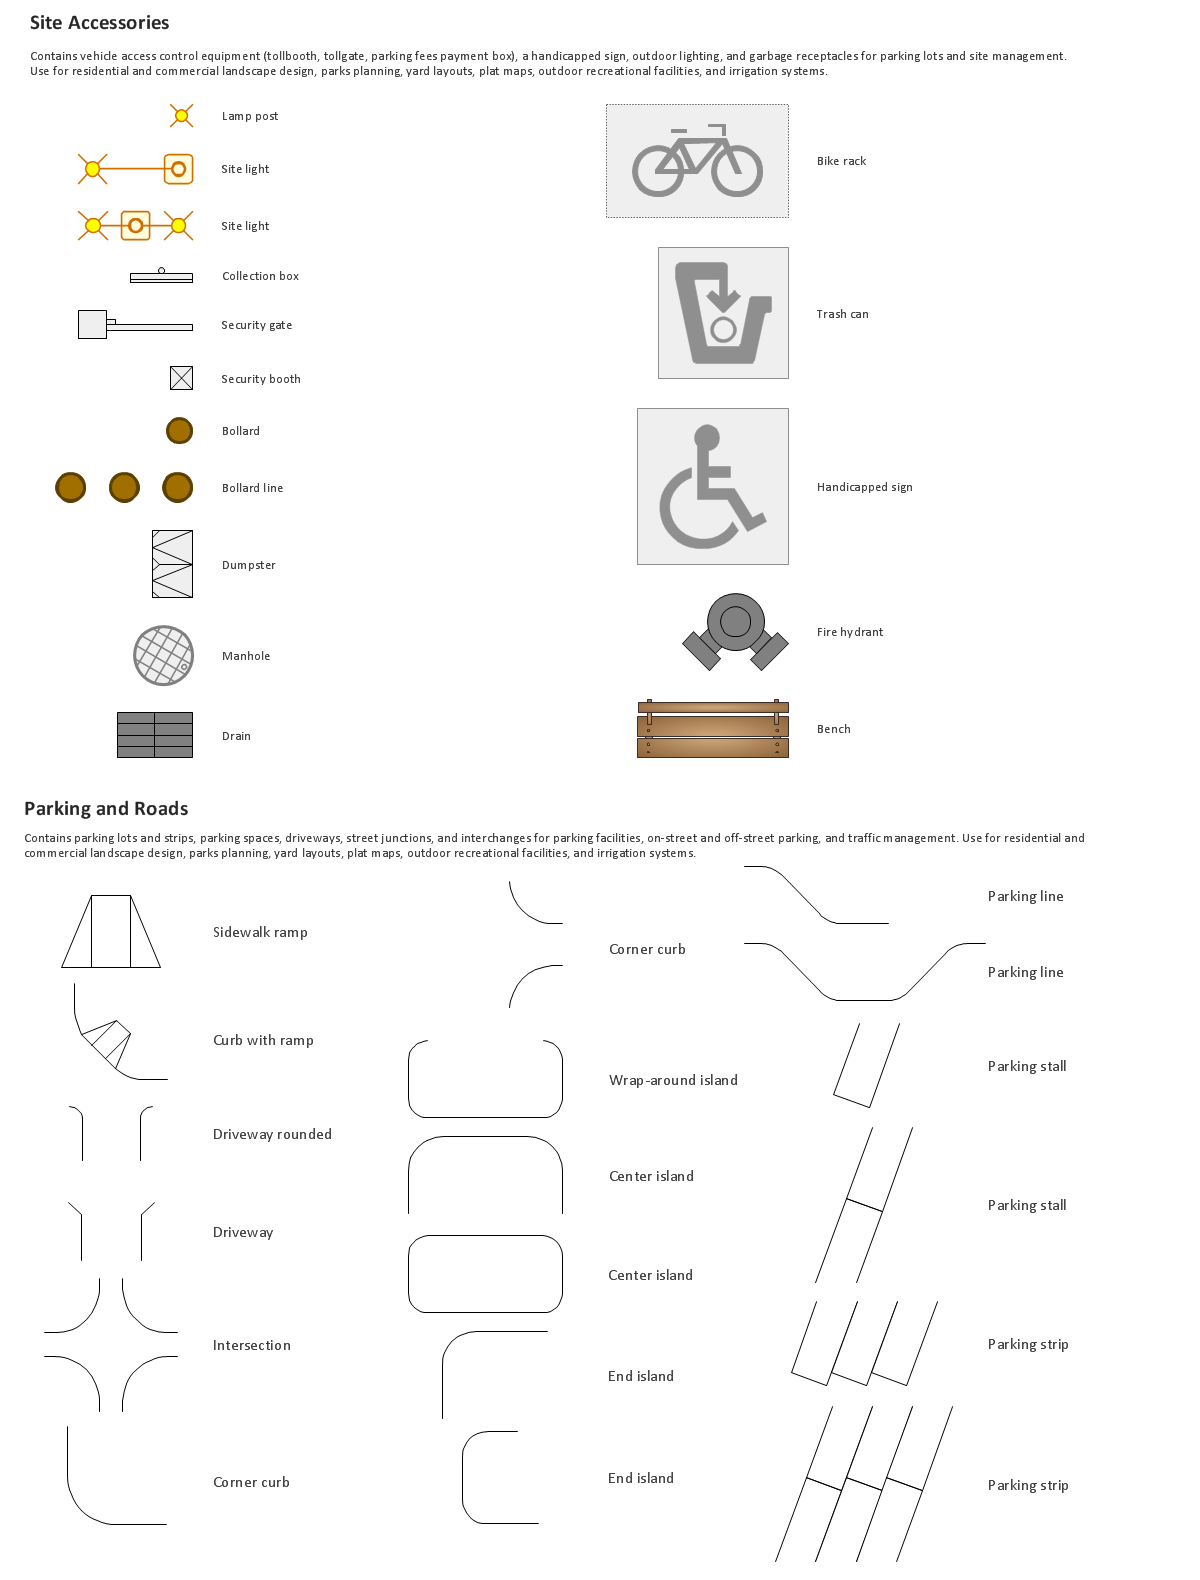
Building Drawing. Design Element Site Plan

Pie Chart Examples and Templates

 Bar Graphs
The Bar Graphs solution enhances ConceptDraw DIAGRAM functionality with templates, numerous professional-looking samples, and a library of vector stencils for drawing different types of Bar Graphs, such as Simple Bar Graph, Double Bar Graph, Divided Bar Graph, Horizontal Bar Graph, Vertical Bar Graph, and Column Bar Chart.
Flow Chart Symbols

Network Topology


Building Drawing Software for Design Site Plan

This Venn diagram sample shows the relations between Internet marketing professions.
"Online advertising, also called Internet advertising, uses the Internet to deliver promotional marketing messages to consumers. It includes email marketing, search engine marketing, social media marketing, many types of display advertising (including web banner advertising), and mobile advertising. Like other advertising media, online advertising frequently involves both a publisher, who integrates advertisements into its online content, and an advertiser, who provides the advertisements to be displayed on the publisher's content. Other potential participants include advertising agencies who help generate and place the ad copy, an ad server who technologically delivers the ad and tracks statistics, and advertising affiliates who do independent promotional work for the advertiser." [Online advertising. Wikipedia]
The diagram example "Internet marketing professions" was created using the ConceptDraw PRO diagramming and vector drawing software extended with the Venn Diagrams solution from the area "What is a Diagram" of ConceptDraw Solution Park.
Venn diagram

 People
This solution extends ConceptDraw DIAGRAM software with samples, templates and libraries of vector clipart for drawing the People illustrations. Use it to make professional-looking documents, presentations and websites illustrated with color scalable vector c
- Professional Service Process Example
- Travel And Mapping Software Its Profession Example Of Software ...
- Computer Network Architecture. Computer and Network Examples ...
- Internet marketing professions | Venn Diagrams | Internet marketing ...
- Professional Weakness And Strengths Examples
- Example Of A Professional Management Flowchart
- Internet marketing professions | HR professions - Vector stencils ...
- Aerospace clipart example | When I grow up... | Professions - Vector ...
- Best Website For Professional Flowchart Examples
- Organizational Charts | Create Sophisticated Professional Diagrams ...