Cause and Effect Diagram

 Pharmacy Illustrations
Pharmacy Illustrations solution with improbable quantity of predesigned vector objects and icons of pharmacy symbols, medical and health products, pharmacy images of drugstore products, pharmacy clipart of medication tools, pharmacy logo, and other pharmacy pictures is the best for designing the pharmacy illustrations of varied kinds, pharmacy and medical diagrams and schematics, for making the presentation slides and posters on the medical, pharmacy, pharmacology and pharmaceutical thematics, for designing the illustrative materials about ways of prevention diseases and also treatment them, for creation colorful illustrations helpful in newborn and baby care, the infographics and collages to be presented at the premises of medical establishments and during the lectures at the medical education institutions, also on the billboards and in other advertising materials.
Flowchart Symbols Accounting. Activity-based costing (ABC) flowchart

Flowchart Marketing Process. Flowchart Examples

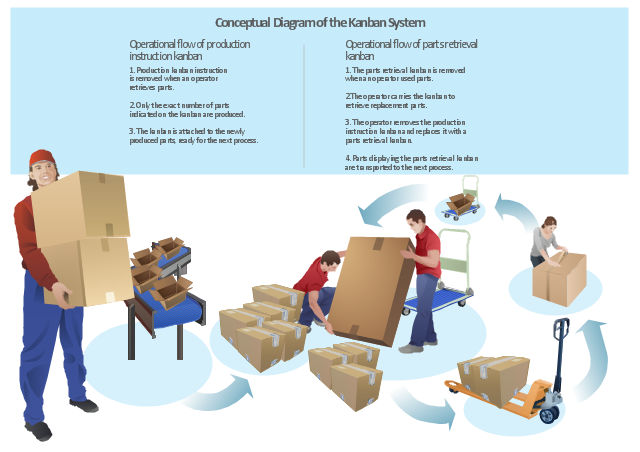
"Kanban ... (literally signboard or billboard) is a scheduling system for lean and just-in-time (JIT) production. Kanban is a system to control the logistical chain from a production point of view, and is not an inventory control system. Kanban was developed by Taiichi Ohno, at Toyota, to find a system to improve and maintain a high level of production. Kanban is one method through which JIT is achieved.
Kanban became an effective tool in support of running a production system as a whole, and it proved to be an excellent way for promoting improvement. Problem areas were highlighted by reducing the number of kanban in circulation." [Kanban. Wikipedia]
The example "Conceptual diagram of the Kanban System" was created in the ConceptDraw PRO diagramming and vector drawing software using the vector stencils library Packaging, loading, customs.
The example "Conceptual diagram of the Kanban System" is included in the Manufacturing and Maintenance solution from the Illustration area of ConceptDraw Solution Park.
Infographics
Flowchart Components

Basic Flowchart Symbols and Meaning


Network Diagram Software Enterprise Private Network


 Manufacturing and Maintenance
Manufacturing and maintenance solution extends ConceptDraw PRO software with illustration samples, templates and vector stencils libraries with clip art of packaging systems, industrial vehicles, tools, resources and energy.
Process Flow Diagram Symbols

- Production Process System Illustration
- Process Flowchart | Production Of Brukutu
- Workflow Diagrams | Manufacturing Process System Diagram
- Biology | Flow Chart Of Citric Acid Production In Microbiology
- Process Flowchart | Entity-Relationship Diagram (ERD) | Production ...
- Production Schematic System In A Diagram
- Entity-Relationship Diagram (ERD) | Diagram Of Production Process ...
- Pepsi Production Process
- Block Diagram Of Various Production System
- Cross-Functional Process Map Template | Flowchart For Production ...