KPI Dashboard

Business Graphics Software
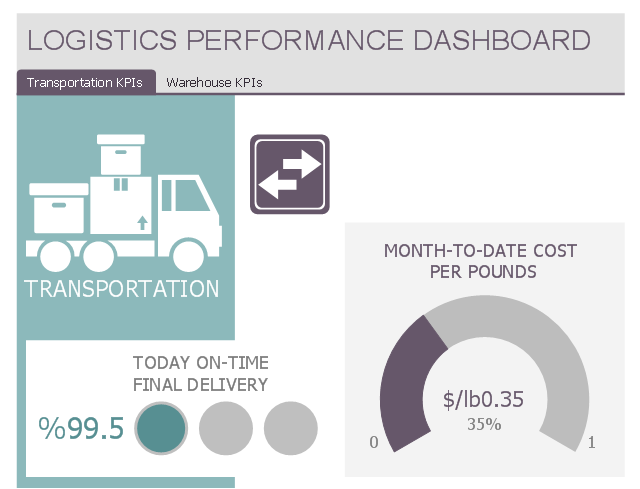
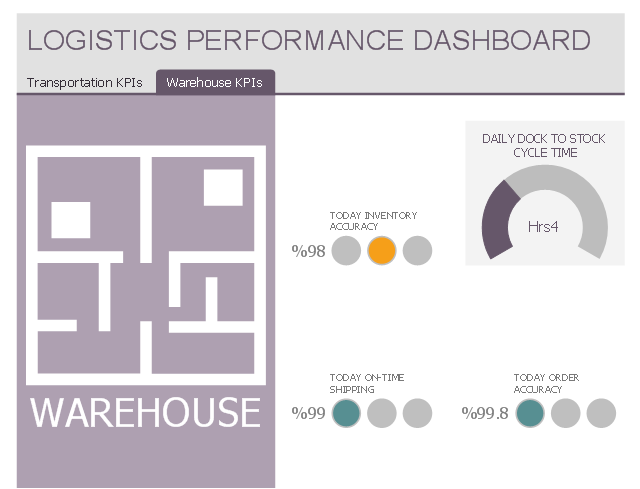
This multipage performance dashboard example shows navigation tab set and graphic indicators of logistic key performance indicators (KPIs) and business metrics.
"Dashboards often provide at-a-glance views of KPIs (key performance indicators) relevant to a particular objective or business process (e.g. sales, marketing, human resources, or production)." [Dashboard (business). Wikipedia]
The business dashboard example "Logistics Performance Dashboard" was designed using ConceptDraw PRO software extended with Logistic Dashboard solution from Business Processes area of ConceptDraw Solution Park.
Transportation KPIs
Warehouse KPIs
How to Create Presentation of Your Project Gantt Chart

 Logistic Dashboard
The powerful tools of Logistic Dashboard solution and specially developed live graphic objects of logistic icons, logistic navigation elements, logistic indicators, logistic charts and logistic maps effectively assist in designing Logistic dashboards, Logistic maps, Logistic charts, diagrams and infographics. The included set of prebuilt samples and quick-start templates, demonstrates the power of ConceptDraw PRO software in logistics management, its assisting abilities in development, realization and analyzing the logistic processes, as well as in perfection the methods of logistics management.
 Entity-Relationship Diagram (ERD)
Entity-Relationship Diagram (ERD) solution extends ConceptDraw PRO software with templates, samples and libraries of vector stencils from drawing the ER-diagrams by Chen's and crow’s foot notations.
Basic Flowchart Images. Flowchart Examples

 Workflow Diagrams
Workflow Diagrams solution extends ConceptDraw PRO software with samples, templates and vector stencils library for drawing the work process flowcharts.
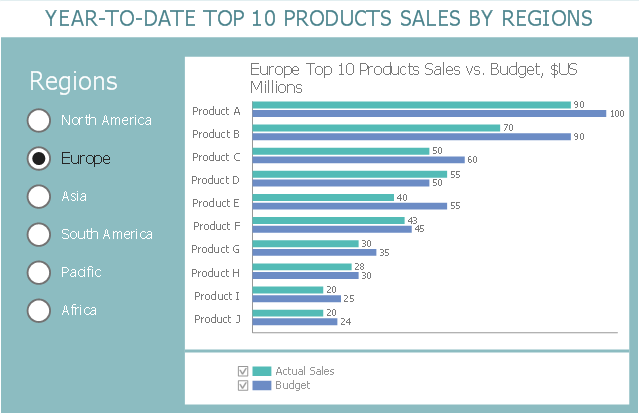
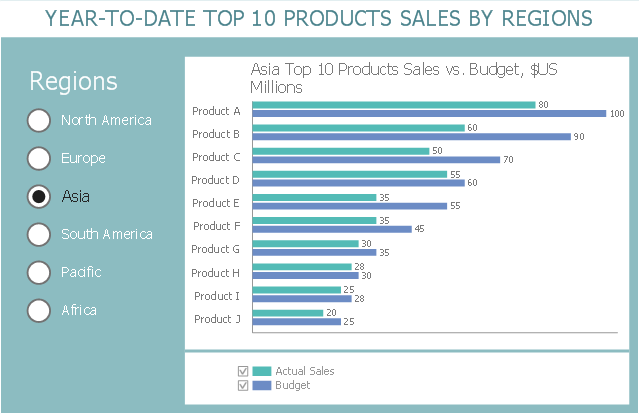
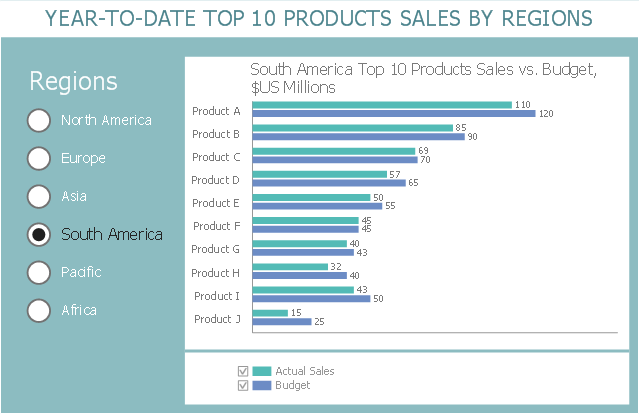
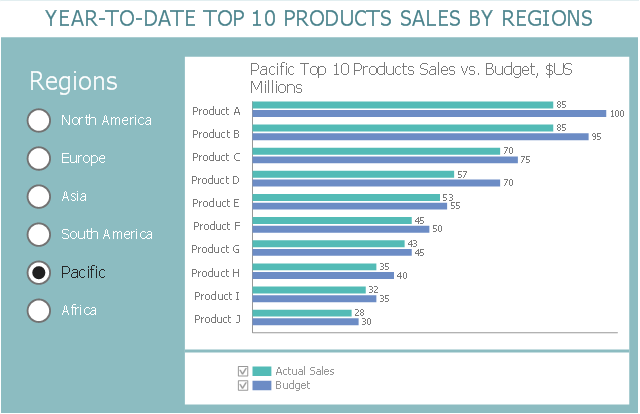
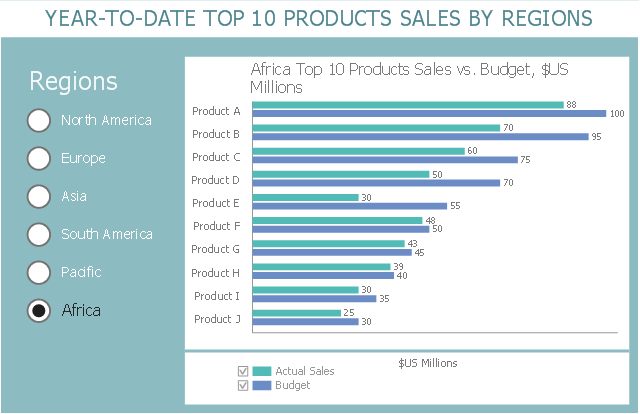
This business intelligence dashboard sample shows the year-to-date top 10 products sales by regions using horizontal bar charts.
"Dashboards often provide at-a-glance views of KPIs (key performance indicators) relevant to a particular objective or business process (e.g. sales, marketing, human resources, or production). In real-world terms, "dashboard" is another name for "progress report" or "report."" [Dashboard (business). Wikipedia]
The BI dashboard example "Year-to-date Top 10 Products Sales by Regions" was created using ConceptDraw PRO software extended with the Business Intelligence Dashboards solution from the Business Processes area of ConceptDraw Solution Park.
North America

Europe
Asia
South America
Pacific
Africa
Activity on Node Network Diagramming Tool

 Fishbone Diagram
Fishbone Diagrams solution extends ConceptDraw PRO software with templates, samples and library of vector stencils for drawing the Ishikawa diagrams for cause and effect analysis.
 Value Stream Mapping
Value stream mapping solution extends ConceptDraw PRO software with templates, samples and vector stencils for drawing the Value Stream Maps (VSM) in lean manufacturing practice.
"As a discipline, task management embraces several key activities. Various conceptual breakdowns exist, and these, at a high-level, always include creative, functional, project, performance and service activities.
Creative activities pertain to task creation. In context, these should allow for task planning, brainstorming, creation, elaboration, clarification, organization, reduction, targeting and preliminary prioritization.
Functional activities pertain to personnel, sales, quality or other management areas, for the ultimate purpose of ensuring production of final goods and services for delivery to customers. In context these should allow for planning, reporting, tracking, prioritizing, configuring, delegating, and managing of tasks.
Project activities pertain to planning and time and costs reporting. These can encompass multiple functional activities but are always greater and more purposeful than the sum of its parts. In context project activities should allow for project task breakdown, task allocation, inventory across projects, and concurrent access to task databases.
Service activities pertain to client and internal company services provision, including customer relationship management and knowledge management. In context these should allow for file attachment and links to tasks, document management, access rights management, inventory of client & employee records, orders & calls management, and annotating tasks.
Performance activities pertain to tracking performance and fulfillment of assigned tasks. In context these should allow for tracking by time, cost control, stakeholders and priority; charts, exportable reports, status updates, deadline adjustments, and activity logging.
Report activities pertain to the presentation of information regarding the other five activities listed, including graphical display." [Task management. Wikipedia]
The example "Project tasks dashboard" was created using the ConceptDraw PRO diagramming and vector drawing software extended with the Status Dashboard solution from the area "What is a Dashboard" of ConceptDraw Solution Park.
Project tasks dashboard

How To Create Project Report

Performance Indicators

- Digital Production Dashboard
- Manufacturing Dashboard Examples
- Kpi Dashboard Examples
- Dashboard Examples Sales Leads Production
- Excel Production Dashboard Templates
- Production Dashboard Ideas
- Metric Dashboard Examples
- Human Resource Dashboard Example
- Manufacturing and Maintenance | Business Intelligence Dashboard ...
- Dashboard Kpi Production
- Performance dashboard
- Visualize Sales Data Using Sample Data | Sales Dashboard ...
- Productivity Human Resources Dashboard Example
- Performance Indicators | PM Dashboards | Design elements - Sales ...
- KPIs and Metrics | Sales Dashboard Template | Data Visualization ...
- Key Performance Indicators Templates
- Example Customer Services Dashboard Power Bi
- Sales Process Flowchart. Flowchart Examples | Process Flowchart ...
- Status Dashboard | Project task status dashboard - Template | PM ...