KPI Dashboard

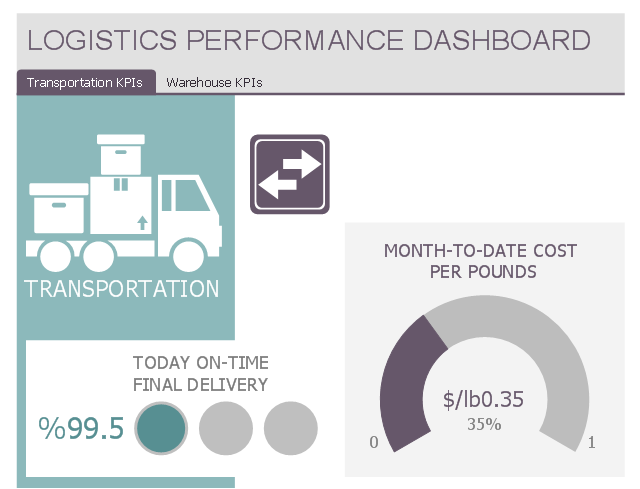
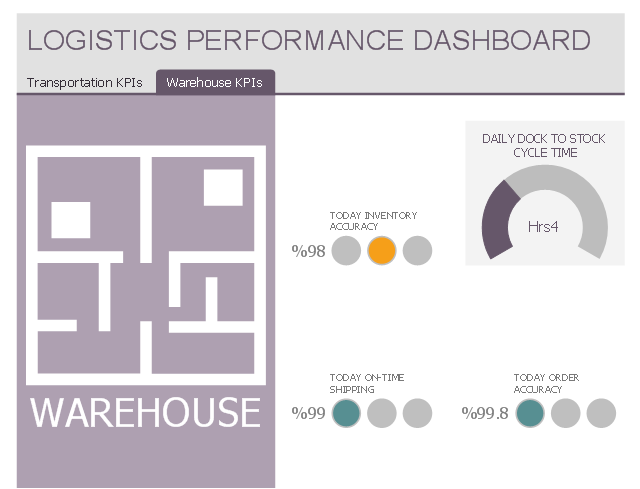
This multipage performance dashboard example shows navigation tab set and graphic indicators of logistic key performance indicators (KPIs) and business metrics.
"Dashboards often provide at-a-glance views of KPIs (key performance indicators) relevant to a particular objective or business process (e.g. sales, marketing, human resources, or production)." [Dashboard (business). Wikipedia]
The business dashboard example "Logistics Performance Dashboard" was designed using ConceptDraw PRO software extended with Logistic Dashboard solution from Business Processes area of ConceptDraw Solution Park.
Transportation KPIs
Warehouse KPIs
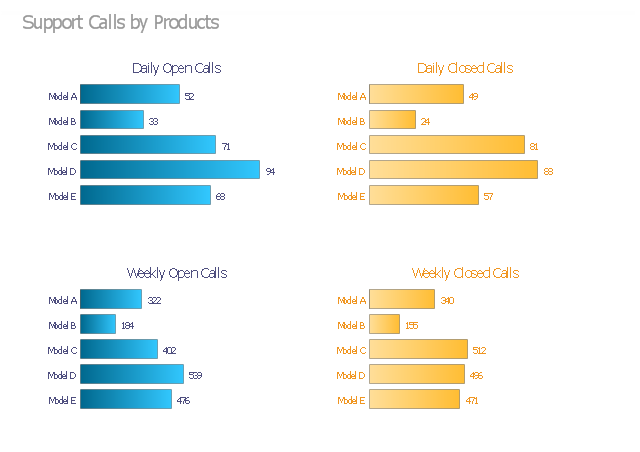
The visual dashboard example "Support calls by products" contains 4 horizontal bar charts used for the comparison of support calls data by products.
"Dashboards often provide at-a-glance views of KPIs (key performance indicators) relevant to a particular objective or business process (e.g. sales, marketing, human resources, or production). ... Dashboards give signs about a business letting the user know something is wrong or something is right. The corporate world has tried for years to come up with a solution that would tell them if their business needed maintenance or if the temperature of their business was running above normal. Dashboards typically are limited to show summaries, key trends, comparisons, and exceptions." [Dashboard (business). Wikipedia]
The business dashboard example "Support calls by products" was created using the ConceptDraw PRO diagramming and vector drawing software extended with the Comparison Dashboard solution from the area "What is a Dashboard" of ConceptDraw Solution Park.
Visual dashboard
 Workflow Diagrams
Workflow Diagrams solution extends ConceptDraw DIAGRAM software with samples, templates and vector stencils library for drawing the work process flowcharts.
 Entity-Relationship Diagram (ERD)
Entity-Relationship Diagram (ERD) solution extends ConceptDraw DIAGRAM software with templates, samples and libraries of vector stencils from drawing the ER-diagrams by Chen's and crow’s foot notations.
 Office Layout Plans
Office layouts and office plans are a special category of building plans and are often an obligatory requirement for precise and correct construction, design and exploitation office premises and business buildings. Designers and architects strive to make office plans and office floor plans simple and accurate, but at the same time unique, elegant, creative, and even extraordinary to easily increase the effectiveness of the work while attracting a large number of clients.
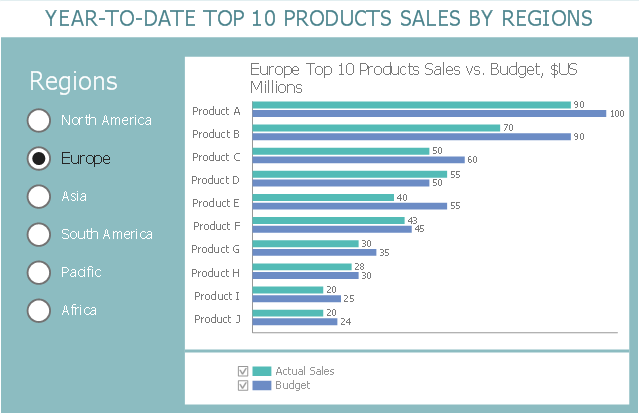
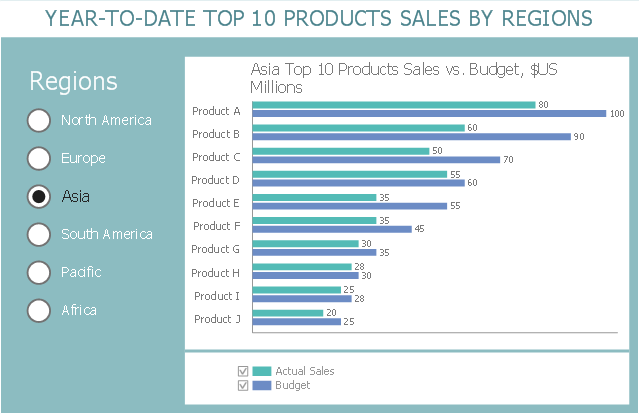
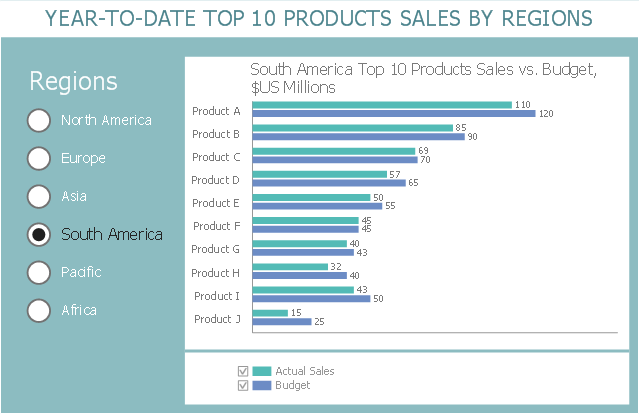
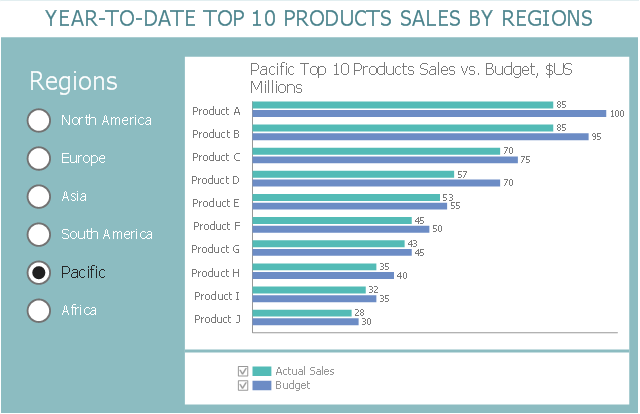
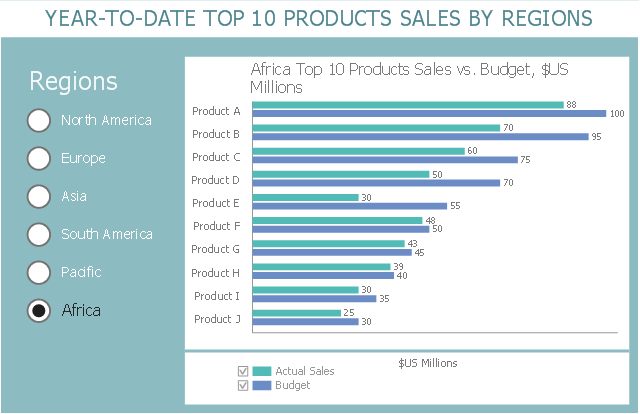
This business intelligence dashboard sample shows the year-to-date top 10 products sales by regions using horizontal bar charts.
"Dashboards often provide at-a-glance views of KPIs (key performance indicators) relevant to a particular objective or business process (e.g. sales, marketing, human resources, or production). In real-world terms, "dashboard" is another name for "progress report" or "report."" [Dashboard (business). Wikipedia]
The BI dashboard example "Year-to-date Top 10 Products Sales by Regions" was created using ConceptDraw PRO software extended with the Business Intelligence Dashboards solution from the Business Processes area of ConceptDraw Solution Park.
North America

Europe
Asia
South America
Pacific
Africa
HelpDesk
How to Create a Bubble Diagram

 Entity-Relationship Diagram (ERD)
An Entity-Relationship Diagram (ERD) is a visual presentation of entities and relationships. That type of diagrams is often used in the semi-structured or unstructured data in databases and information systems. At first glance ERD is similar to a flowch
Cross Functional Flowchart Examples

Business Diagram Software


Affinity Diagram Software

 HR Flowcharts
Human resource management diagrams show recruitment models, the hiring process and human resource development of human resources.
 Cafe and Restaurant Floor Plans
Restaurants and cafes are popular places for recreation, relaxation, and are the scene for many impressions and memories, so their construction and design requires special attention. Restaurants must to be projected and constructed to be comfortable and e
- Production Dashboard Examples
- Manufacturing and Maintenance | Business Intelligence Dashboard ...
- Dashboard Kpi Production
- Manufacturing Dashboard Examples
- Digital Production Dashboard
- Kpi Dashboard Examples
- Human Resource Dashboard Example
- Example Customer Services Dashboard Power Bi
- Progress Dashboard Examples
- Performance dashboard
- Productivity Human Resources Dashboard Example
- Account Flowchart Stockbridge System. Flowchart Examples | Data ...
- Manufacturing Kpi Dashboard
- Excel Production Dashboard Templates
- Performance Indicators | PM Dashboards | Design elements - Sales ...
- Metric Dashboard Examples
- Performance Indicators | KPI Dashboard | What is a KPI? | Key ...
- Basic Flowchart Examples | KPI Dashboard | Managing your Sales ...
- Example Project Dashboard
- Status Dashboard | Construction Project Chart Examples | How to ...