This financila dashboard example was drawn on the base of the Enterprise dashboard from the Mecklenburg County Government website.
[charmeck.org/ mecklenburg/ county/ CountyManagersOffice/ OMB/ dashboards/ Pages/ Enterprise.aspx]
"In management information systems, a dashboard is "an easy to read, often single page, real-time user interface, showing a graphical presentation of the current status (snapshot) and historical trends of an organization’s key performance indicators to enable instantaneous and informed decisions to be made at a glance."
For example, a manufacturing dashboard may show key performance indicators related to productivity such as number of parts manufactured, or number of failed quality inspections per hour. Similarly, a human resources dashboard may show KPIs related to staff recruitment, retention and composition, for example number of open positions, or average days or cost per recruitment.
Types of dashboards.
Dashboard of Sustainability screen shot illustrating example dashboard layout.
Digital dashboards may be laid out to track the flows inherent in the business processes that they monitor. Graphically, users may see the high-level processes and then drill down into low level data. This level of detail is often buried deep within the corporate enterprise and otherwise unavailable to the senior executives.
Three main types of digital dashboard dominate the market today: stand alone software applications, web-browser based applications, and desktop applications also known as desktop widgets. The last are driven by a widget engine.
Specialized dashboards may track all corporate functions. Examples include human resources, recruiting, sales, operations, security, information technology, project management, customer relationship management and many more departmental dashboards.
Digital dashboard projects involve business units as the driver and the information technology department as the enabler. The success of digital dashboard projects often depends on the metrics that were chosen for monitoring. Key performance indicators, balanced scorecards, and sales performance figures are some of the content appropriate on business dashboards." [Dashboard (management information systems). Wikipedia]
The example "Enterprise dashboard" was created using the ConceptDraw PRO diagramming and vector drawing software extended with the Composition Dashboard solution from the area "What is a Dashboard" of ConceptDraw Solution Park.
Financial dashboard

 Event-driven Process Chain Diagrams
Event-Driven Process Chain Diagrams solution extends ConceptDraw DIAGRAM functionality with event driven process chain templates, samples of EPC engineering and modeling the business processes, and a vector shape library for drawing the EPC diagrams and EPC flowcharts of any complexity. It is one of EPC IT solutions that assist the marketing experts, business specialists, engineers, educators and researchers in resources planning and improving the business processes using the EPC flowchart or EPC diagram. Use the EPC solutions tools to construct the chain of events and functions, to illustrate the structure of a business process control flow, to describe people and tasks for execution the business processes, to identify the inefficient businesses processes and measures required to make them efficient.
Account Flowchart. Flowchart Examples

Pyramid Chart Examples

"Causes in the diagram are often categorized, such as to the 6 M's ...
The 6 Ms (used in manufacturing industry):
(1) Machine (technology);
(2) Method (process);
(3) Material (Includes Raw Material, Consumables and Information.);
(4) Man Power (physical work)/ Mind Power (brain work): Kaizens, Suggestions;
(5) Measurement (Inspection);
(6) Milieu/ Mother Nature (Environment).
The original 6Ms used by the Toyota Production System have been expanded by some to include the following and are referred to as the 8Ms. However, this is not globally recognized. It has been suggested to return to the roots of the tools and to keep the teaching simple while recognizing the original intent; most programs do not address the 8Ms.
(7) Management/ Money Power;
(8) Maintenance." [Ishikawa diagram. Wikipedia]
This 8Ms Ishikawa diagram (manufacturing cause and effect diagram) template is included in the Fishbone Diagram solution from the Management area of ConceptDraw Solution Park.
8Ms Ishikawa diagram

Data Flow Diagram Symbols. DFD Library

Material Requisition Flowchart. Flowchart Examples

Account Flowchart Stockbridge System. Flowchart Examples

Bar Diagrams for Problem Solving. Create manufacturing and economics bar charts with Bar Graphs Solution

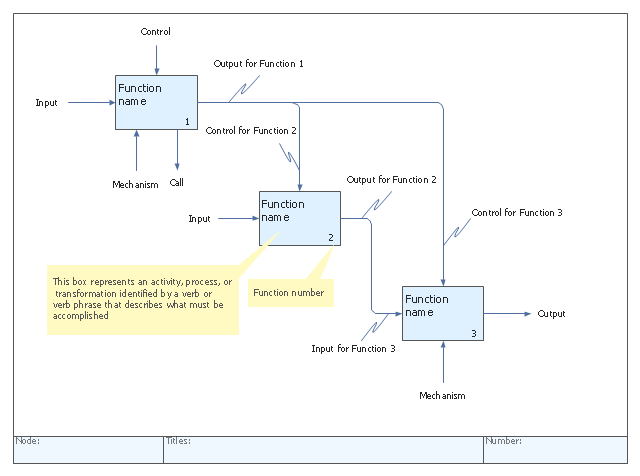
"IDEF0, a compound acronym (Icam DEFinition for Function Modeling, where 'ICAM' is an acronym for Integrated Computer Aided Manufacturing) is a function modeling methodology for describing manufacturing functions, which offers a functional modeling language for the analysis, development, reengineering, and integration of information systems; business processes; or software engineering analysis.
IDEF0 is part of the IDEF family of modeling languages in the field of software engineering, and is built on the functional modeling language Structured Analysis and Design Technique (SADT). ...
FIPS PUB 183 "Integration Definition for Function Modeling (IDEF0)," was withdrawn as a Federal Standard (in favor of OPEN Specifications and Standards) September 2, 2008, as cited in "The Federal Register", Volume 73, page 51276 (73FR/ 51276). ...
IDEF0, used to produce a "function model". A function model is a structured representation of the functions, activities or processes within the modeled system or subject area." [IDEF0. Wikipedia]
The template "IDEF0 diagram" is included in the IDEF0 Diagrams solution from the Software Development area of ConceptDraw Solution Park.
IDEF0 template
- Manufacturing Information System Dfd
- Last resort hotel book room process - DFD | Levels Of Dfd Wikipedia
- Graphical Kpis For Manufacturing
- Information Technology Organizational Chart
- Fishbone diagram - Template | Manufacturing 8 Ms fishbone ...
- Accounting Information Systems Flowchart Symbols | Dfd Model Of ...
- 5 Level pyramid model diagram - Information systems types | Draw ...
- Bar Diagrams for Problem Solving. Create manufacturing and ...
- 4 Level pyramid model diagram - Information systems types | 5 Level ...