 Seven Basic Tools of Quality
Manage quality control in the workplace, using fishbone diagrams, flowcharts, Pareto charts and histograms, provided by the Seven Basic Tools of Quality solution.
Seven Basic Tools of Quality — Quality Control

ConceptDraw DIAGRAM Compatibility with MS Visio

Root Cause Analysis


The Action Plan

Accounts Payable Flowchart

Flowchart Symbols Accounting. Activity-based costing (ABC) flowchart

Sales Dashboards for Your Company
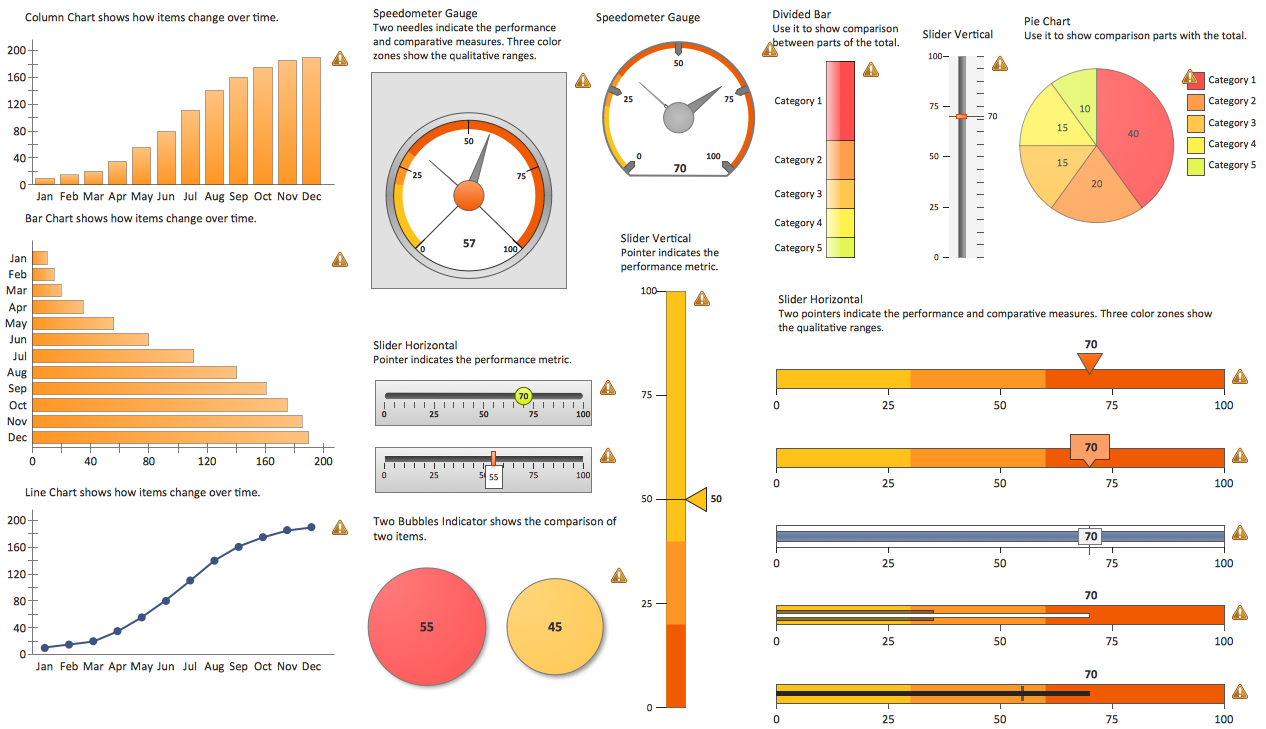
A KPI Dashboard
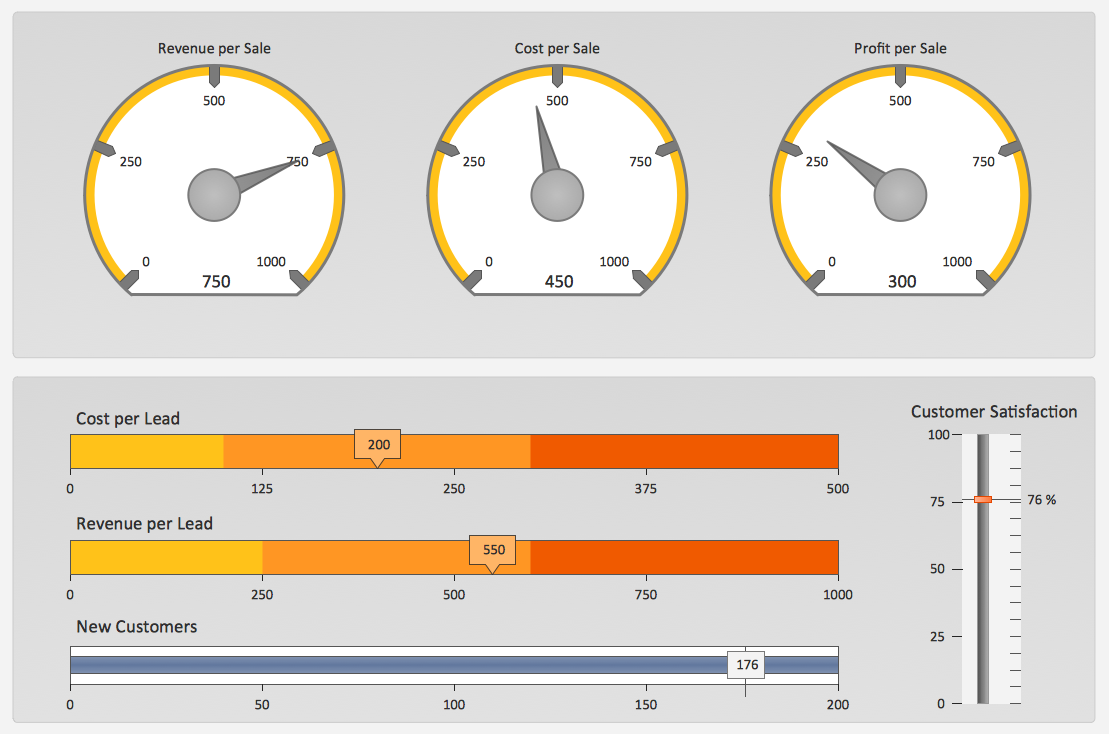
KPIs and Metrics

- Fishbone Diagram Example On Procurement
- Root Cause Analysis | Fishbone Diagram Problem Solving ...
- Payroll process - Swim lane process mapping diagram | Sales ...
- Cause and effect diagram - Increase in productivity | Ecosystem ...
- Root cause analysis tree diagram - Template | How To Create Root ...
- Porter's value chain matrix diagram | Value Stream Mapping ...
- Flow chart Example. Warehouse Flowchart | Porter's value chain ...
- How To Create Root Cause Analysis Diagram Using ConceptDraw ...
- Supplier Root Cause Analysis Plan Presentation
- Data Flow Diagram Symbols. DFD Library | Porter's value chain ...