This site uses cookies. By continuing to browse the ConceptDraw site you are agreeing to our Use of Site Cookies.

chemical engineering, process engineering, process flow diagram symbols, process and instrumentation diagram, process diagrams Chemical and Process Engineering

chemical engineering, process engineering, process flow diagram symbols, process and instrumentation diagram, process diagrams
This chemical engineering solution extends ConceptDraw PRO v.9.5 (or later) with process flow diagram symbols, samples, process diagrams templates and libraries of design elements for creating process and instrumentation diagrams, block flow diagrams (BFD

Flow Chart Symbols

Flowcharts are used in designing and documenting simple processes or programs. Like other types of diagrams, they help visualize what is going on and thereby help understand a process, and perhaps also find flaws, bottlenecks, and other less-obvious features within it. There are many different types of flowcharts, and each type has its own repertoire of boxes and notational conventions.
Flowchart diagrams consists of symbols of process, decision, data and document, data base, termination or initiation processes, processing loops and conditions. To create an drawn flowchart use professional flowchart maker of ConceptDraw PRO.

Sample Pictorial Chart. Sample Infographics

Sample Pictorial Chart - Pictorial Infographics solution provides easy-to-use design infographics drawing tools, large collection of different sample infographics and infograms, sample pictorial chart and templates to be filled in, and 10 libraries with great quantity of predesigned vector pictograms.
Use Pictorial Infographics solution to draw your own design pictorial infographics documents quick and easy.
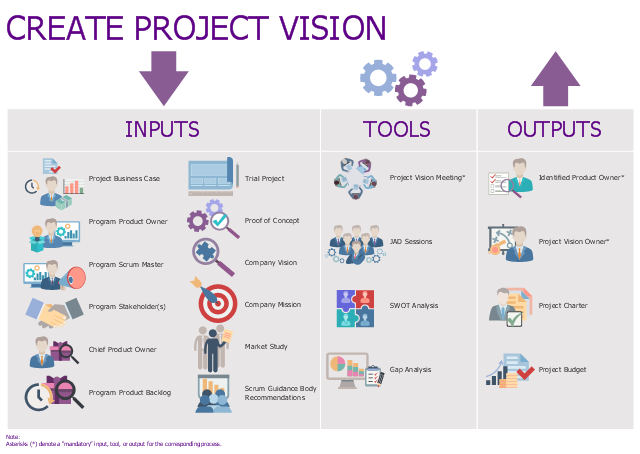
This infographic example was designed on the base of Fig. 8-3 "Create Project Vision — Inputs, Tools, and Outputs " on the page 137 of the "A Guide to the SCRUM BODY OF KNOWLEDGE (SBOK™ Guide) 2016 Edition".
" Create Project Vision — In this process, the Project Business Case is reviewed to create a Project Vision Statement that will serve as the inspiration and provide focus for the entire project. The Product Owner is identified in this process."
[scrumstudy.com/ SBOK/ SCRUMstudy-SBOK-Guide-2013.pdf]
This example of agile software development infographic was created using the ConceptDraw PRO software extended with the Scrum solution from the Project Management area of ConceptDraw Solution Park.
Infographic
Infographic, whole team, unit testing, team velocity chart, team member, team lead, stakeholder, sprint retrospective meeting, sprint demo, review meeting, scrum theme, scrum task board, scrum meeting, scrum maturity, scrum master, return on investment (ROI), requirements analysis, requirement, prototyping, program optimization, product review, product owner, operations staff, objective, light bulb, integration testing, integration, duration, drawing shapes, customer, commitment-based planning, check, banknote bundle, arrow up, arrow down, Definition of Done, DoD, BI tools,
HelpDesk

How to Draw a Chemical Process Flow Diagram

Process Flow Diagram widely used in modeling of processes in the chemical industry. A Chemical Process Flow diagram (PFD) is a specialized type of flowchart. With the help of Chemical Process Flow Diagram engineers can easily specify the general scheme of the processes and chemical plant equipment. Chemical Process Flow Diagram displays the real scheme of the chemical process, the relationship between the equipment and the technical characteristics of the process. Chemical Process Flow Diagram illustrates the connections between the basic equipment as well as the overall structure of pipelines and other supporting equipment. The purpose of the PFD is to build the image of the basic idea of ​​the chemical process. ConceptDraw PRO together with its Chemical and Process Engineering solution delivers the possibility to design Chemical Process Flow diagrams. It is designed for chemical industry engineers and designers.

Cross-Functional Flowchart

Cross-Functional Flowchart - to draw cross functional process maps is by starting with a cross-functional flowchart samples and templates. Easy to draw sample cross functional Process Flow Diagrams. Using a Cross-Functional flowchart is a clear way of showing each team member’s responsibilities and how processes get shared or transferred between different teams and departments.
Use cross-functional flowcharts to show the relationship between a business process and the functional units (such as departments) responsible for that process. To create it use the best flowchart maker of ConceptDraw PRO.
How to Draw a Cross Functional Flowchart using visio alternative ConceptDraw PRO as visio for mac

Process Flowchart

ConceptDraw is Professional business process mapping software for making process flow diagram, workflow diagram, general flowcharts and technical illustrations for business documents. It is includes rich examples, templates, process flowchart symbols. ConceptDraw flowchart maker allows you to easier create a process flowchart. Use a variety of drawing tools, smart connectors, flowchart symbols and shape libraries to create flowcharts of complex processes, process flow diagrams, procedures and information exchange.
How To Create a Process Flow Chart (business process modelling techniques)

Process Flow Diagram Symbols

Chemical and Process Engineering Solution from the Industrial Engineering Area of ConceptDraw Solution Park is a unique tool which contains variety of predesigned process flow diagram symbols for easy creating various Chemical and Process Flow Diagrams in ConceptDraw PRO.

Marketing Plan Infographic

You need design the Marketing Plan Infographic and dream to find the useful tools to draw it easier, quickly and effectively? ConceptDraw PRO offers the unique Marketing Infographics Solution from the Business Infographics Area that will help you!

logistics flow charts, logistics planning, logistics and supply chain, logistics management software, inventory flow chart Logistics Flow Charts

logistics flow charts, logistics planning, logistics and supply chain, logistics management software, inventory flow chart
Logistics Flow Charts solution extends ConceptDraw PRO v11 functionality with opportunities of powerful logistics management software. It provides large collection of predesigned vector logistic symbols, pictograms, objects and clipart to help you design with pleasure Logistics flow chart, Logistics process flow diagram, Inventory flow chart, Warehouse flowchart, Warehouse management flow chart, Inventory control flowchart, or any other Logistics diagram. Use this solution for logistics planning, to reflect logistics activities and processes of an enterprise or firm, to depict the company's supply chains, to demonstrate the ways of enhancing the economic stability on the market, to realize logistics reforms and effective products' promotion.