Risk Diagram (Process Decision Program Chart)

"Business process mapping refers to activities involved in defining what a business entity does, who is responsible, to what standard a business process should be completed, and how the success of a business process can be determined.
The main purpose behind business process mapping is to assist organizations in becoming more efficient. A clear and detailed business process map or diagram allows outside firms to come in and look at whether or not improvements can be made to the current process.
Business process mapping takes a specific objective and helps to measure and compare that objective alongside the entire organization's objectives to make sure that all processes are aligned with the company's values and capabilities.
ISO 9001 requires a business entity to follow a process approach when managing its business, and to this end creating business process maps will assist. The entity can then work towards ensuring its processes are effective (the right process is followed the first time), and efficient (continually improved to ensure processes use the smallest amount of resources)." [Business process mapping. Wikipedia]
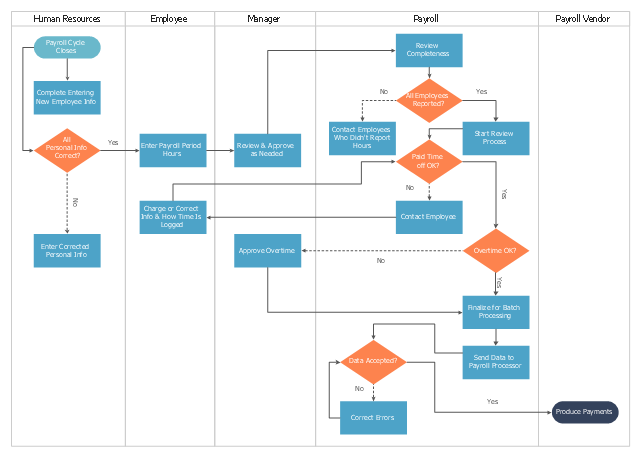
The swim lane process map example "Payroll process" was drawn using the ConceptDraw PRO diagramming and vector drawing software extended with the Cross-Functional Flowcharts solution from the Business Processes area of ConceptDraw Solution Park.
The main purpose behind business process mapping is to assist organizations in becoming more efficient. A clear and detailed business process map or diagram allows outside firms to come in and look at whether or not improvements can be made to the current process.
Business process mapping takes a specific objective and helps to measure and compare that objective alongside the entire organization's objectives to make sure that all processes are aligned with the company's values and capabilities.
ISO 9001 requires a business entity to follow a process approach when managing its business, and to this end creating business process maps will assist. The entity can then work towards ensuring its processes are effective (the right process is followed the first time), and efficient (continually improved to ensure processes use the smallest amount of resources)." [Business process mapping. Wikipedia]
The swim lane process map example "Payroll process" was drawn using the ConceptDraw PRO diagramming and vector drawing software extended with the Cross-Functional Flowcharts solution from the Business Processes area of ConceptDraw Solution Park.
Swim lane process mapping diagram
 Business Process Mapping
The Business Process Mapping solution for ConceptDraw PRO is for users involved in process mapping and creating SIPOC diagrams.
Basic Flowchart Symbols and Meaning


PDPC

Cross-Functional Flowchart


This accounting flowchart example was created on the base of the figure illustrating webpage "CHAPTER 4. CONDUCTING AN ADMINISTRATIVE REVIEW" from the website of the Federal Highway Administration (FHWA) of the United States Department of Transportation. [fhwa.dot.gov/ legsregs/ directives/ orders/ toolkita2.htm]
"Business process mapping refers to activities involved in defining what a business entity does, who is responsible, to what standard a business process should be completed, and how the success of a business process can be determined.
The main purpose behind business process mapping is to assist organizations in becoming more efficient. A clear and detailed business process map or diagram allows outside firms to come in and look at whether or not improvements can be made to the current process.
Business process mapping takes a specific objective and helps to measure and compare that objective alongside the entire organization's objectives to make sure that all processes are aligned with the company's values and capabilities." [Business process mapping. Wikipedia]
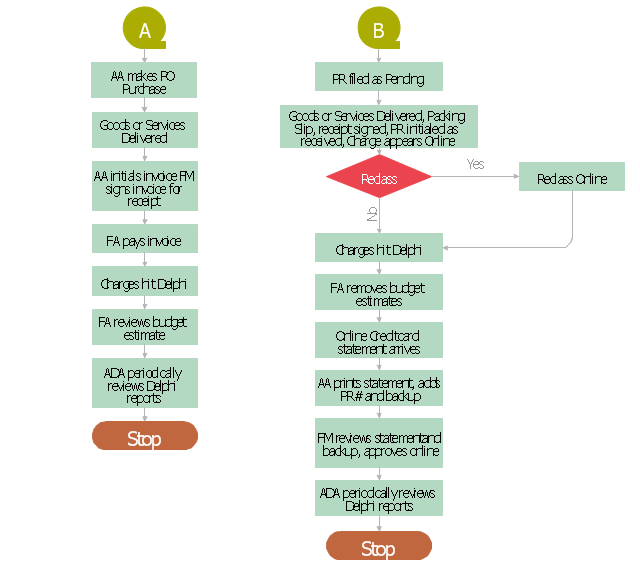
The business process map of procurement process example "Procurement process mapping" was created using the ConceptDraw PRO software extended with the Accounting Flowcharts solution from the Finance and Accounting area of ConceptDraw Solution Park.
"Business process mapping refers to activities involved in defining what a business entity does, who is responsible, to what standard a business process should be completed, and how the success of a business process can be determined.
The main purpose behind business process mapping is to assist organizations in becoming more efficient. A clear and detailed business process map or diagram allows outside firms to come in and look at whether or not improvements can be made to the current process.
Business process mapping takes a specific objective and helps to measure and compare that objective alongside the entire organization's objectives to make sure that all processes are aligned with the company's values and capabilities." [Business process mapping. Wikipedia]
The business process map of procurement process example "Procurement process mapping" was created using the ConceptDraw PRO software extended with the Accounting Flowcharts solution from the Finance and Accounting area of ConceptDraw Solution Park.
Procurement Process Mapping
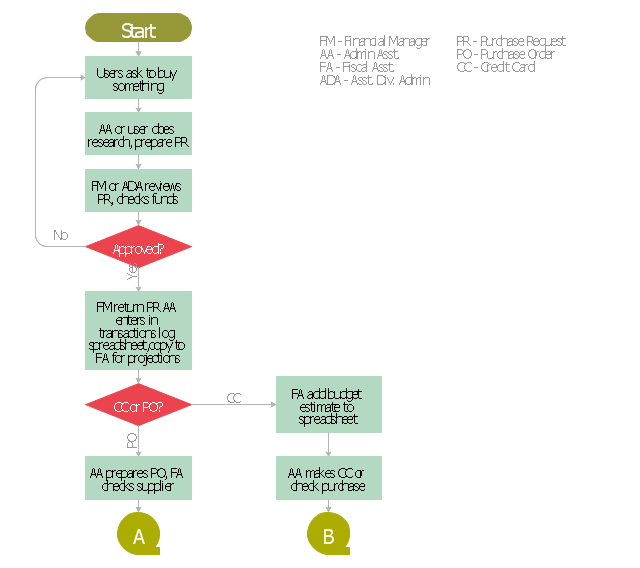
Procurement Mapping Process A, B
Risk Diagram (Process Decision Program Chart)
")
Decision Making Software For Small Business


How To Make the Right Decision in Projects

- Mind Mapping Decision Making Process In Management
- Swim Lane Diagrams | Types of Flowcharts | Business Process ...
- Multiple Decision Point Flow Chart
- Payroll process - Swim lane process mapping diagram | Process ...
- Payroll process - Swim lane process mapping diagram | Cross ...
- Mind Mapping For Decision Process System
- Cross Functional Flowchart for Business Process Mapping | IDEF3 ...
- Flowchart by Hapman | Cross-Functional Process Map Template ...
- Cross-Functional Process Map Template | Business Process ...
- Swim Lane Diagrams | Swim Lane Flowchart Symbols | Cross ...