Root Cause Analysis


Using Fishbone Diagrams for Problem Solving

Fishbone Diagram Problem Solving

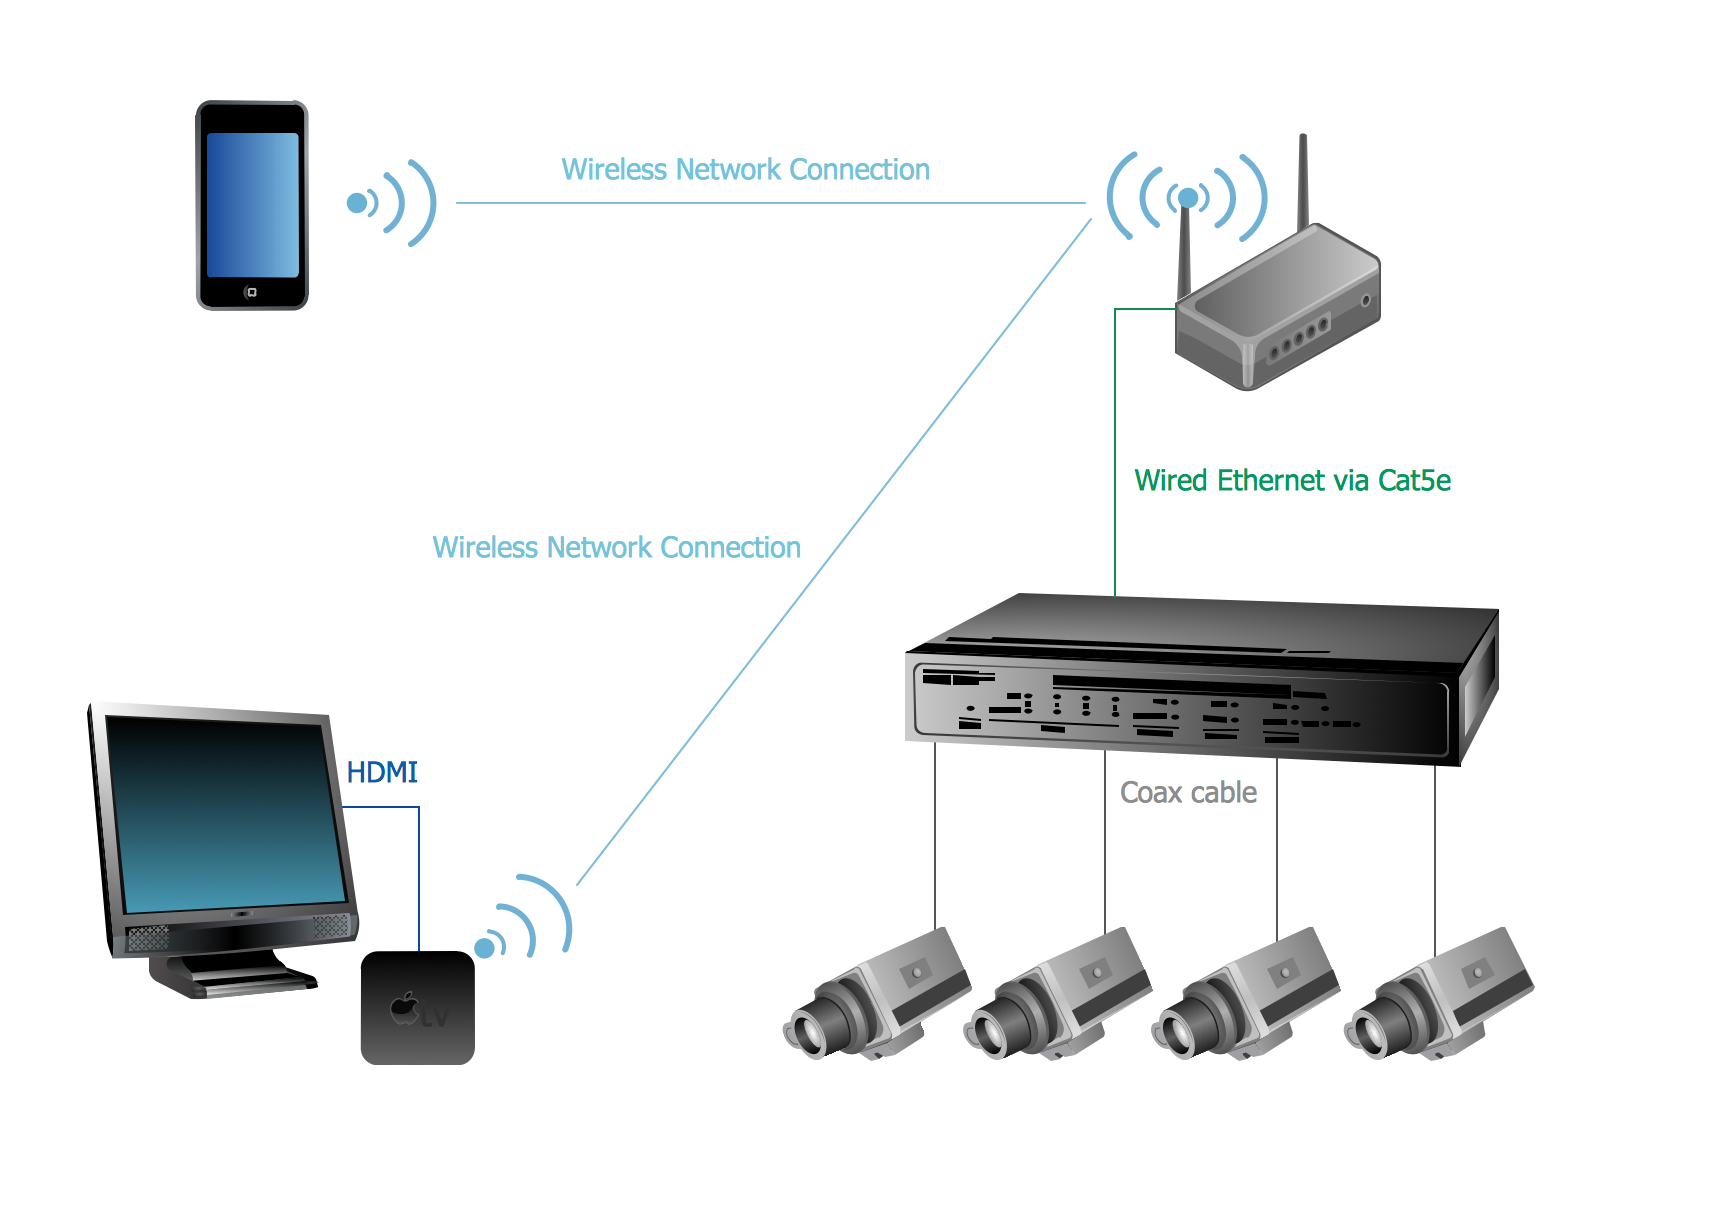
Troubleshooting in Wireless Connection
CCTV Network Example
 Seven Management and Planning Tools
Seven Management and Planning Tools solution extends ConceptDraw DIAGRAM and ConceptDraw MINDMAP with features, templates, samples and libraries of vector stencils for drawing management mind maps and diagrams.
Bar Diagrams for Problem Solving. Create economics and financial bar charts with Bar Graphs Solution

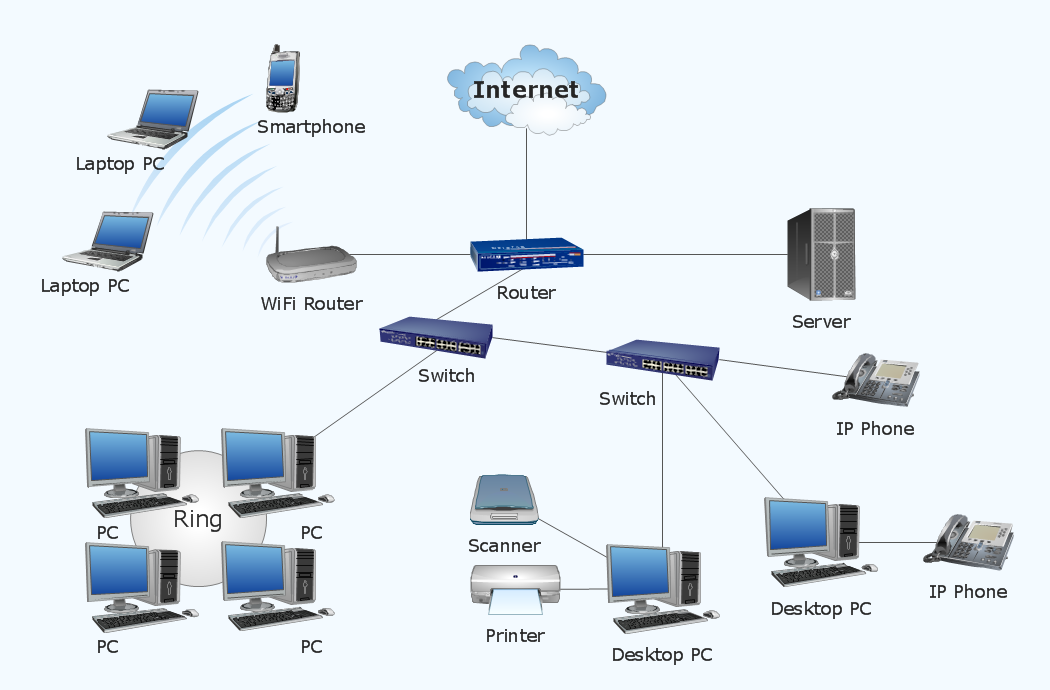
 Computer Network Diagrams
Computer Network Diagrams solution extends ConceptDraw DIAGRAM software with samples, templates and libraries of vector icons and objects of computer network devices and network components to help you create professional-looking Computer Network Diagrams, to plan simple home networks and complex computer network configurations for large buildings, to represent their schemes in a comprehensible graphical view, to document computer networks configurations, to depict the interactions between network's components, the used protocols and topologies, to represent physical and logical network structures, to compare visually different topologies and to depict their combinations, to represent in details the network structure with help of schemes, to study and analyze the network configurations, to communicate effectively to engineers, stakeholders and end-users, to track network working and troubleshoot, if necessary.
The Action Plan

 Fishbone Diagrams
The Fishbone Diagrams solution extends ConceptDraw DIAGRAM software with the ability to easily draw the Fishbone Diagrams (Ishikawa Diagrams) to clearly see the cause and effect analysis and also problem solving. The vector graphic diagrams produced using this solution can be used in whitepapers, presentations, datasheets, posters, and published technical material.
- Network Diagram Problems With Solutions
- Network Diagram Examples | Root cause analysis tree diagram ...
- PERT chart - Sale problem solution | How To Create a PERT Chart ...
- Fishbone Diagram Problem Solving | Using Fishbone Diagrams for ...
- Problem Solution Tree Templates
- PERT Chart | Activity Network Diagram Method | Critical Path ...
- Fault Tree Analysis Diagrams | Root cause analysis tree diagram ...
- Cpm Problems With Solution
- Product Overview | Pert Cpm Example Problems With Solution
- Fishbone Diagram Problem Solving | Cause and Effect Analysis ...