This site uses cookies. By continuing to browse the ConceptDraw site you are agreeing to our Use of Site Cookies.

Basic Flowchart Symbols and Meaning

Flowchart Symbols and Meaning - Provides a visual representation of basic flowchart symbols and their proposed use in professional workflow diagram, standard process flow diagram and communicating the structure of a well-developed web site, as well as their correlation in developing on-line instructional projects. See flowchart's symbols by specifics of process flow diagram symbols and workflow diagram symbols.
How to Build a Flowchart

Flow Chart Symbols

Flowcharts are used in designing and documenting simple processes or programs. Like other types of diagrams, they help visualize what is going on and thereby help understand a process, and perhaps also find flaws, bottlenecks, and other less-obvious features within it. There are many different types of flowcharts, and each type has its own repertoire of boxes and notational conventions.
Flowchart diagrams consists of symbols of process, decision, data and document, data base, termination or initiation processes, processing loops and conditions. To create an drawn flowchart use professional flowchart maker of ConceptDraw PRO.

Flowchart Components

The ConceptDraw Flowchart component includes a set of samples and templates. This geathered as flowchart maker toolbox which focused on drawing flowcharts of any industry standards.

Data Flow Diagram Symbols. DFD Library

Data Flow Diagrams show information transfers and process steps of a system. The general concept is an approach of a depicting how occurs input in a system, further processes and what runs out. The aim of DFD is in accomplishing of understanding between developers and users. Data flow diagrams are maintained with other methods of structured systems analysis.

Flowchart Software

Flowchart is widely used in business, education and economic presentations to help the audience visualize the content better, or to find flaws in a process flow diagrams. Flowcharts are particularly useful for displaying how a process currently flow or could ideally function. Flowcharts can help you see whether the steps of a process are logical, uncover problems or miscommunications, define the boundaries of a process, and develop a common base of knowledge about a process.

ConceptDraw PRO flowchart software will help to quickly create new flowcharts, workflow, NS Diagram, BPMN Diagram, Cross-functional flowcharts, data flow diagrams and highlight flowcharts.

Feature-rich flowchart maker, free thousand flowchart examples and templates and colored symbols that will allow you to create professional looking flowcharts simply.

ConceptDraw PRO supports macOS and Windows.
How to Build a Flowchart

Cross-Functional Flowchart

Cross-Functional Flowchart - to draw cross functional process maps is by starting with a cross-functional flowchart samples and templates. Easy to draw sample cross functional Process Flow Diagrams. Using a Cross-Functional flowchart is a clear way of showing each team member’s responsibilities and how processes get shared or transferred between different teams and departments.
Use cross-functional flowcharts to show the relationship between a business process and the functional units (such as departments) responsible for that process. To create it use the best flowchart maker of ConceptDraw PRO.
How to Draw a Cross Functional Flowchart using visio alternative ConceptDraw PRO as visio for mac

Sales Process Flowchart. Flowchart Examples

Create your own flow charts of sales business processes using the ConceptDraw PRO diagramming and vector drawing software extended with the Cross-Functional Flowcharts solution from the Business Processes area or Sales Flowcharts from the Marketing area of ConceptDraw Solution Park.

Audit Process Flowchart. Audit Flowchart

Audit Process Flowchart, Audit Flowchart - Audit Flowcharts solution for ConceptDraw PRO Solution Park provides the Audit Flowcharts library with wide variety of predesigned audit flowchart symbols, and also the set of templates and samples allowing you design your own audit flowchart or audit process flowchart in one moment. Simply use any of offered samples and change it for your needs, or fill the desired template.
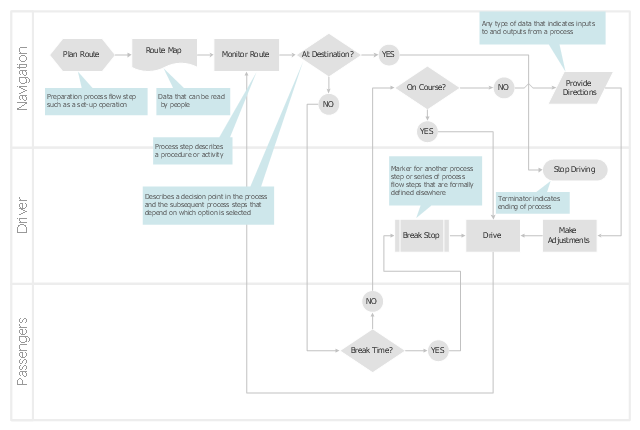
Cross-Functional (Deployment) Flowcharts visualize what functional units (people, departments or functional areas) are responsible for the business process operations. The flowcharts are divided into rows/ columns of functional units. Blocks of various shapes represent the process steps, and are placed in rows/ columns of the responsible functional units. These flowcharts are used to display the relationships of processes and responsible functional units.
The cross-functional horizontal flowchart template for the ConceptDraw PRO diagramming and vector drawing software is included in the Cross-Functional Flowcharts solution from the Business Processes area of ConceptDraw Solution Park.
Cross-functional flowchart template
Cross-functional flowchart template, yes, terminator, process, predefined process, process, preparation, no, horizontal swimlanes, document, decision, data,

How to Create Flowcharts for an Accounting Information System

Accounting information is a system of processes to represent financial and accounting data that is used by decision makers. To represent accounting processes there are special symbols which are used to create accounting flowcharts.
Flowcharts help users of Accounting Information System to understand the step sequences of accounting processes. Use ConceptDraw PRO with Accounting Flowcharts solution to document and communicate visually how accounting processes work, and how each operation is done.