Pie Donut Chart. Pie Chart Examples
This sample shows the Pie Donut Chart. It was created in ConceptDraw DIAGRAM diagramming and vector drawing software using the ready-to-use object from the Pie Charts Solution from Graphs and Charts area of ConceptDraw Solution Park. The Pie Donut Chart visualizes the percentage of parts of the whole and looks like as a ring divided into sectors. Pie Donut Charts are widely used in the business, statistics, analytics, mass media.Pie Chart
ConceptDraw DIAGRAM diagramming and vector drawing software offers the Pie Charts solution from the Graphs and Charts area of ConceptDraw Solution Park for quick and easy drawing the Pie Chart of any complexity.Percentage Pie Chart. Pie Chart Examples
This sample was created in ConceptDraw DIAGRAM diagramming and vector drawing software using the Pie Charts Solution from Graphs and Charts area of ConceptDraw Solution Park. This sample shows the Pie Chart of the approximate air composition. You can see the percentage of oxygen, nitrogen and other gases in the air visualized on this Pie Chart.Export from ConceptDraw MINDMAP to PowerPoint® Presentation
ConceptDraw MINDMAP extended with Presentation Exchange solution allows you to create a traditional PowerPoint Presentation from your mind maps.
to MS PowerPoint
Pie Chart Examples and Templates
A pie chart or a circle graph is a circular chart divided into sectors, illustrating numerical proportion. In a pie chart, the arc length of each sector and consequently its central angle and area, is proportional to the quantity it represents. Pie chart examples and templates created using ConceptDraw DIAGRAM software helps you get closer with pie charts and find pie chart examples suite your needs.
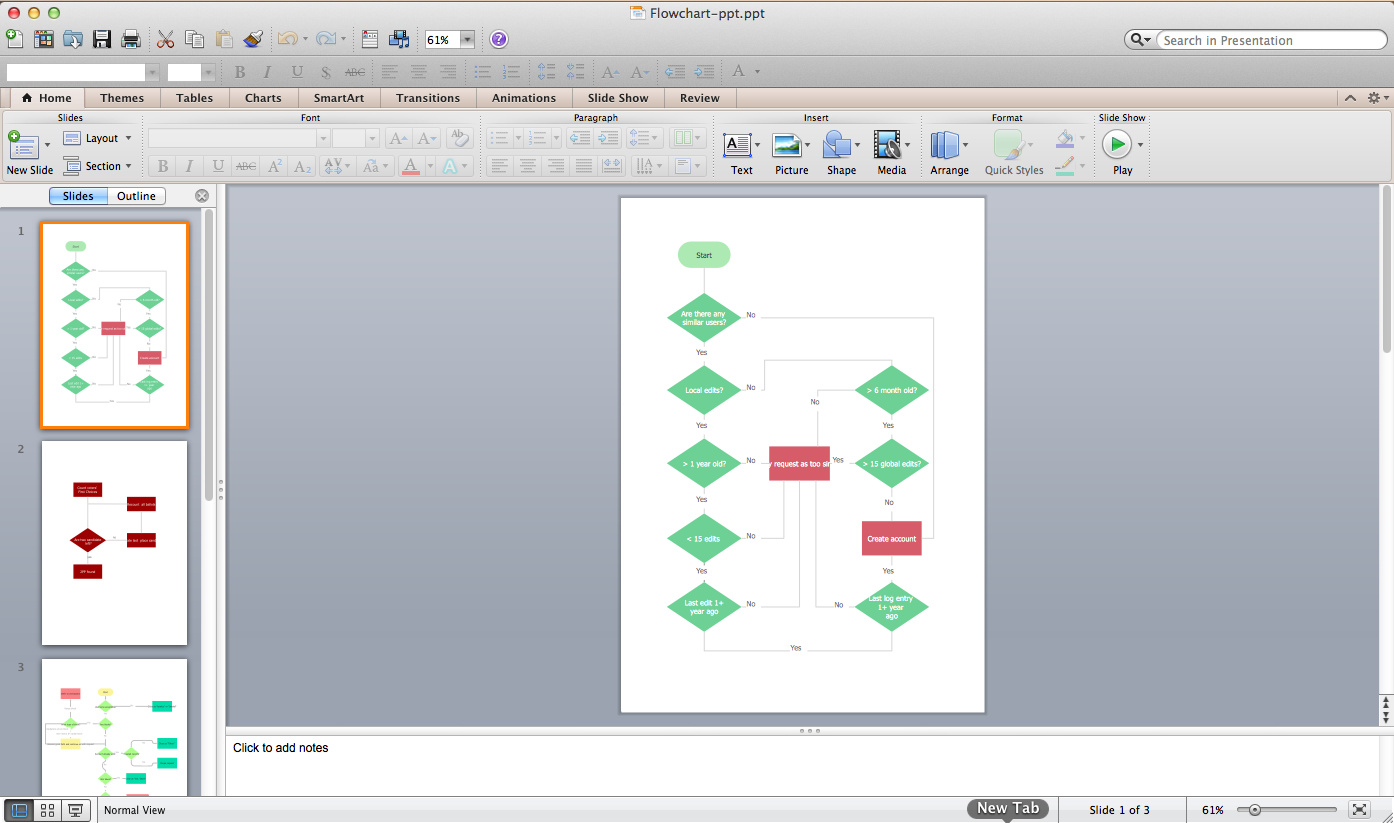
Flowcharts in PowerPoint
To create flowcharts in MS PowerPoint, programs designed specifically for the purpose of creating flowcharts are particularly well-suited to the task.Business Report Pie. Pie Chart Examples
This sample shows the Business Report Pie Chart. The Pie Chart visualizes the data as the proportional parts of a whole, illustrates the numerical proportion. Pie Charts are very useful in the business, statistics, analytics, mass media.
Pie Charts
Pie Charts are extensively used in statistics and business for explaining data and work results, in mass media for comparison (i.e. to visualize the percentage for the parts of one total), and in many other fields. The Pie Charts solution for ConceptDraw DIAGRAM offers powerful drawing tools, varied templates, samples, and a library of vector stencils for simple construction and design of Pie Charts, Donut Chart, and Pie Graph Worksheets.
HelpDesk
How to Draw a Pie Chart
A pie chart represents data, in a clear and easy to read around (pie) form. A circular pie chart is divided into sections (slice). Each "slice" depicts the It reflects the proportion of each component in the whole "pie". This type of chart is most often used for the visualization of statistical data. That is why pie charts are widely used in marketing. As the pie charts show proportional parts of a whole, they are good for various visual comparisons. For example, it is difficult to imagine a more intuitive way to show segmentation and market share. ConceptDraw DIAGRAM allows you to draw a simple and clear Pie Chart using the Pie Charts solution.Chart Maker for Presentations
Easy charting software comes with beautiful chart templates and examples. This makes it easy to create professional charts without prior experience.- Atmosphere air composition | Percentage Pie Chart . Pie Chart ...
- Draw A Pie Chart Showing Different Gases And Their Percentage In
- Pie Charts | How to Draw the Different Types of Pie Charts ...
- Free Ppt Sample Templates With Graphs And Charts
- Pie Diagram In Statistics Ppt
- How to Add a Block Diagram to a PowerPoint Presentation Using ...
- Powerpoint Chart Templates Free Download
- Pie Donut Chart. Pie Chart Examples
- Percentage Pie Chart . Pie Chart Examples | Atmosphere air ...
- Percentage Pie Chart . Pie Chart Examples | Export from ...