How to Create Presentation of Your Project Gantt Chart
During the planning, discussing and execution of a project you may need to prepare a presentation using project views such as the Gantt Chart, Multiproject Dashboard or Resource Usage View. It’s easy do with ConceptDraw PROJECT!Dashboard
ConceptDraw PRO extended with Sales Dashboard solution from the Marketing area of ConceptDraw Solution Park is a perfect software for creating the live dashboard for the business data and progress visualization.KPI Dashboard
ConceptDraw PRO diagramming and vector drawing software supplied with Sales Dashboard solution from the Marketing area of ConceptDraw Solution Park provides the full set of useful tools which make it the best for producing the live KPI Dashboard of any complexity.Sales Dashboard
Sales Dashboard is a useful and visual way of representing sales performances, tracking and analyzing sales. It gives a clear picture about the business development success and sales growth progress. ConceptDraw PRO software extended with Sales Dashboard solution from the Marketing area of ConceptDraw Solution Park is effective for visualizing sales data, all set of KPIs on the Sales Dashboard with purpose to see how your business develops and to make conclusions for improvement the sales.Export from ConceptDraw PRO Document to PPT or PPTX (MS PowerPoint®) File
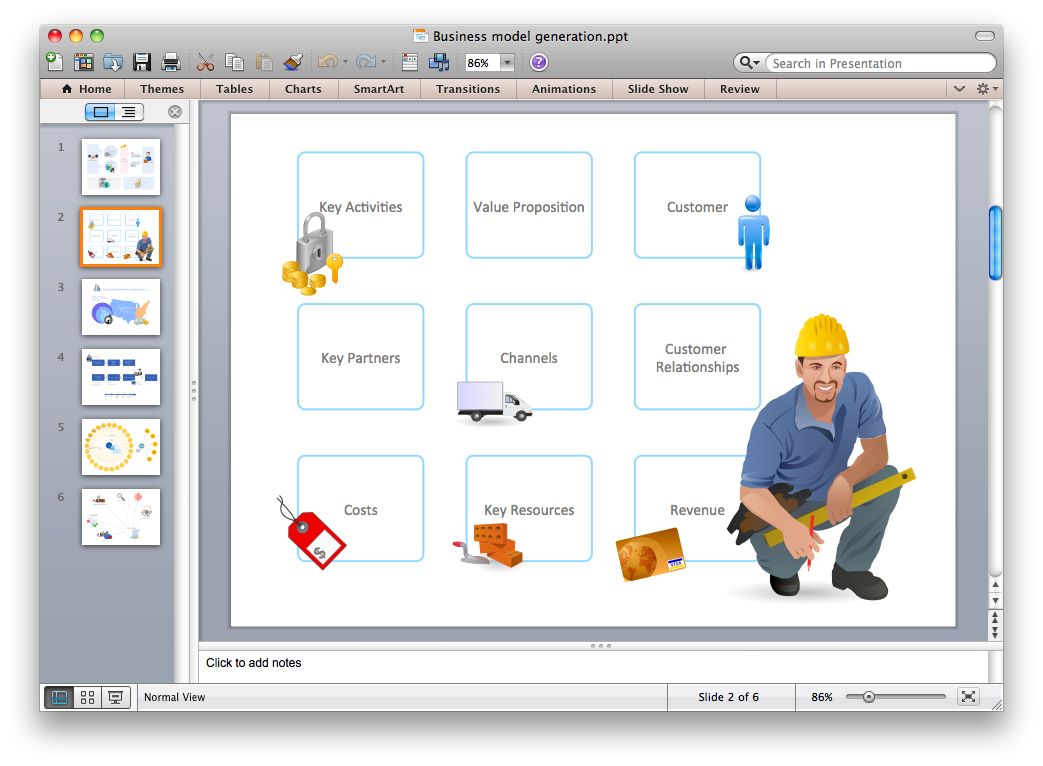
ConceptDraw PRO has extensive export capabilities which allow you to export your drawing to
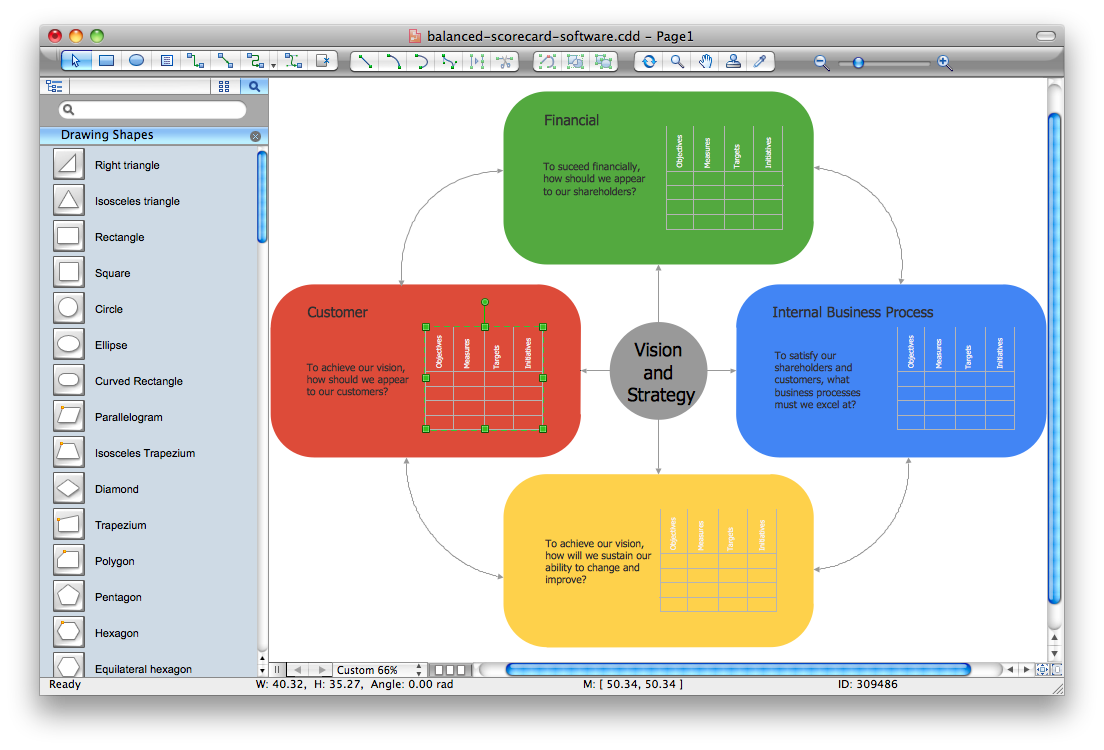
Balanced Scorecard Software
Balanced Scorecard Software provide incredible large variety of samples, templates and libraries of predesigned vector objects. Nothing could be easy that use the predesigned template and fill it, and simply drag the ready-to-use objects for designing your own balanced scorecard diagram.What is a KPI?
What is a KPI? Key performance indicators (KPIs) represent a set of measures that are focused on the aspects of organizational performance which are the most important for its current and future success. ConceptDraw PRO diagramming and vector drawing software enhanced with Sales Dashboard solution from the Marketing area of ConceptDraw Solution Park allows effectively develop, analyze and improve your business thanks to the excellent possibility of monitoring all KPIs on one screen in a real time.HelpDesk
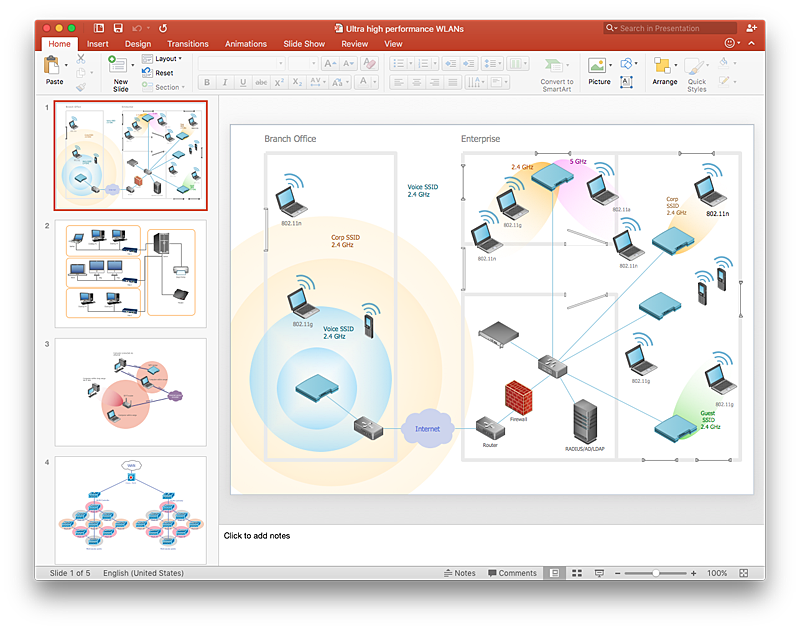
How to Add a Wireless Network Diagram to a PowerPoint Presentation Using ConceptDraw PRO
The PowerPoint presentation of wireless network can be very informative. ConceptDraw PRO allows you to easily create wireless network diagrams and then make a PowerPoint Presentation from your diagrams in a single click.HelpDesk
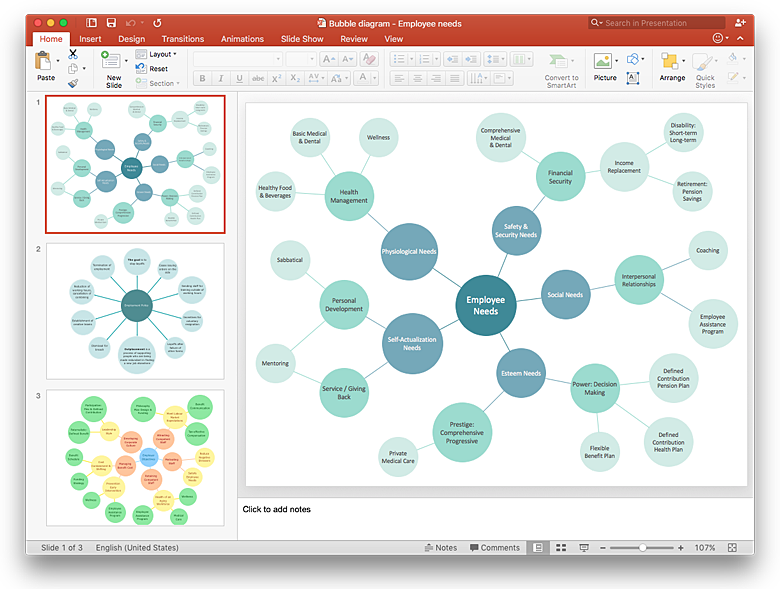
How to Add a Bubble Diagram to a PowerPoint Presentation Using ConceptDraw PRO
Bubble diagrams can be used to compare concepts, and identify areas of similarity and difference. ConceptDraw PRO allows you to make a MS PowerPoint Presentation from your charts in a few simple steps.HelpDesk
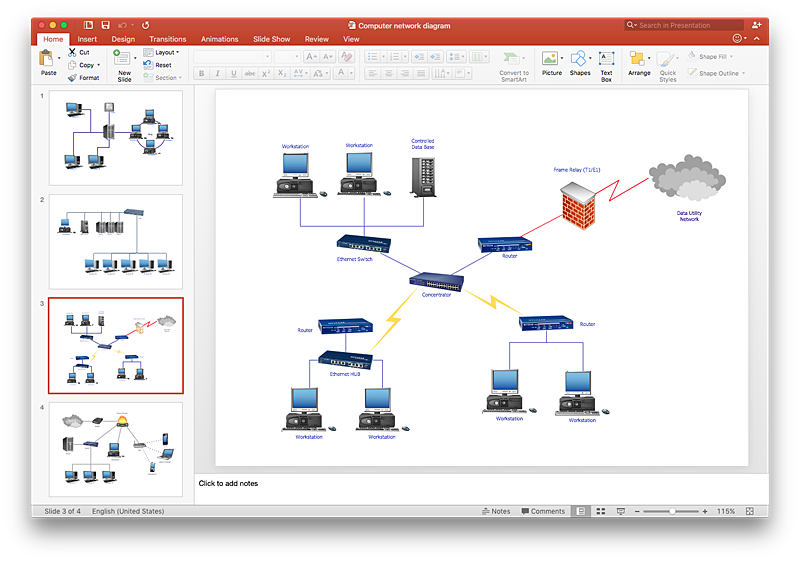
How To Add a Computer Network Diagram to a PowerPoint Presentation Using ConceptDraw PRO
The PowerPoint presentation of computer network can be very informative. ConceptDraw PRO allows you to easily create computer network diagrams and then make a PowerPoint Presentation from your network diagrams in a single click.
 Australia Map
For graphic artists creating accurate maps of Australia. The Australia Map solution - allows designers to map Australia for their needs, offers a collection of scalable graphics representing the political geography of Australia, split into distinct state
HelpDesk
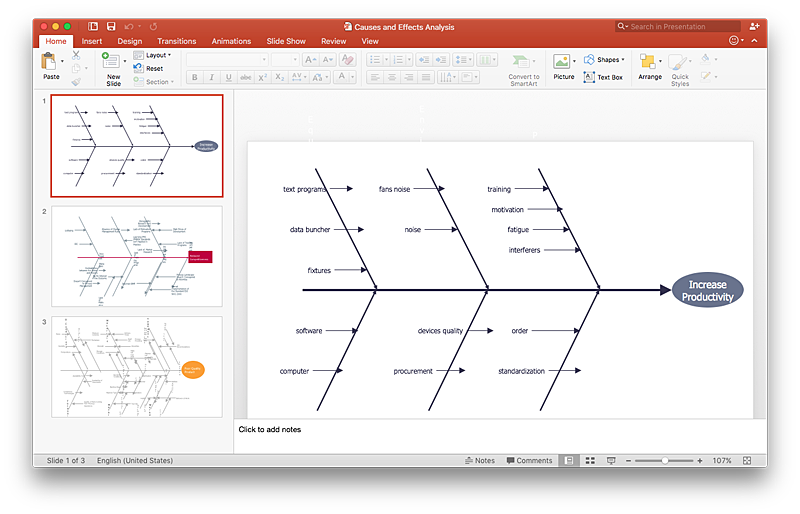
How to Add a Fishbone Diagram to a PowerPoint Presentation Using ConceptDraw PRO
Fishbone (Ishikawa) diagram is often used in business to determine the cause of some problems. The easiest way to draw a Fishbone diagram is using ConceptDraw Fishbone Diagram solution.HelpDesk
How to Create PowerPoint Presentation from Data Driven Infographics Using ConceptDraw PRO
ConceptDraw PRO can be used as a tool for creating data-driven infographics. It allows you to draw data driven using the special templates and vector stencils libraries. ConceptDraw PRO allows you to make a MS PowerPoint Presentation from your Data-driven infographics in a few simple steps.HelpDesk
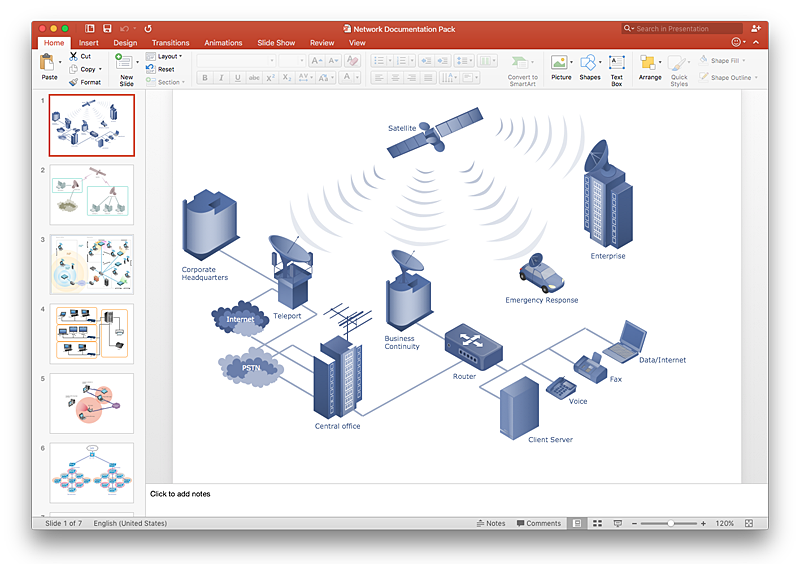
How to Add a Telecommunication Network Diagram to a PowerPoint Presentation Using ConceptDraw PRO
Telecommunication network diagram represents a system consisting of computers, servers, telecommunication devices, switches, satellites, wireless transmitters, antennas, cables, etc., that link a set of remote nodes. It is also describes a telephone exchange, that connects calls between landlines. ConceptDraw PRO allows you to easily create telecommunication network diagrams and then make a PowerPoint Presentation from your network documentation in a few clicks. Telecommunication network diagrams are used to show components and connections in a telecommunications network: how they are interacted between each other and with end-users. The PowerPoint presentation on concept of telecom network can be very informative and helpful. ConceptDraw PRO allows you to make a MS PowerPoint Presentation from your telecommunication network diagrams in a few clicks.HelpDesk
How to Create a Sales Dashboard Using ConceptDraw PRO
Visual dashboard is a valuable tool for any sales team. Sales dashboard allows you to view and monitor sales indicators that are important for manager and sales staff . It helps to use the timely and reliable information to improve the quality of sales performance and increase sales revenues. ConceptDraw Sales Dashboard solution is a tool for both: sales manager and sales team. It provides the visualization of key performance indicators that are critical to the entire sales organization. The custom sales dashboard displays the real-time information on sales performance KPIs with the help of intuitive and easy-to-understand diagrams and charts.
- Free Dashboard Templates Powerpoint
- Powerpoint Kpi Dashboard Layouts
- KPI Dashboard | What is a KPI? | Sales KPI Dashboards | Ppt ...
- KPI Dashboard | What is a KPI? | Performance Indicators | Marketing ...
- KPI Dashboard | What is a KPI? | Data Visualization Software ...
- Dashboard Templates Powerpoint
- Dashboard Design Powerpoint Free Download
- Powerpoint Dashboard Template
- KPI Dashboard | Sales Dashboard | Dashboard | Powerpoint ...
- Dashboard Powerpoint Template Free
- Dashboard Ppt Template Free Download
- Ppt Dashboard
- Powerpoint Dashboard Template Free Download
- Sales Dashboard | Gauge Chart Templates For Word Powerpoint Pdf
- KPI Dashboard | What is a KPI? | Performance Indicators | Kpi ...
- Powerpoint Project Dashboard Template
- KPI Dashboard | How to Add a Circle-spoke Diagram to a ...
- Sales Dashboard | Applications | Software development with ...
- Visualization Of Kpi Ppt
- Percentage Pie Chart. Pie Chart Examples | Sales Dashboards for ...


