 Plant Layout Plans
This solution extends ConceptDraw PRO v.9.5 plant layout software (or later) with process plant layout and piping design samples, templates and libraries of vector stencils for drawing Plant Layout plans. Use it to develop plant layouts, power plant desig
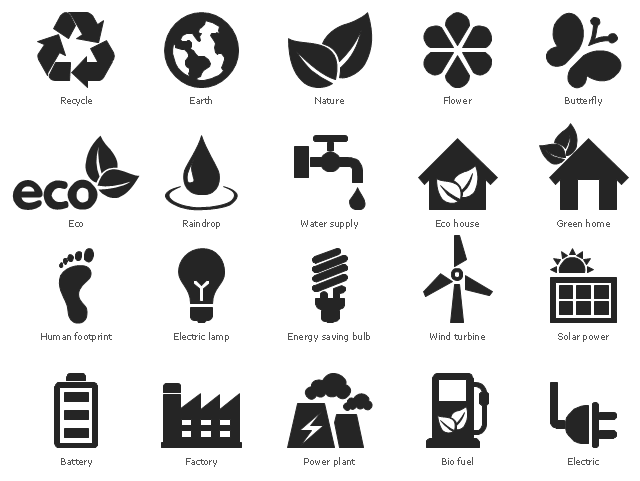
The vector stencils library "Ecology pictograms" contains 20 icons of eco symbols. Use it to draw your ecological infographics. The example "Ecology pictograms - Vector stencils library" was created using the ConceptDraw PRO diagramming and vector drawing software extended with the Pictorial infographics solution from the area "What is infographics" in ConceptDraw Solution Park.
Recycle

Nature

Flower

Butterfly

Earth

Raindrop

Water supply

Eco house

Green home

Electric

Electric lamp

Energy saving bulb

Factory

Power plant
Battery

Bio fuel

Wind turbine

Solar power

Eco

Human footprint

"Consumption of energy resources, (e.g. turning on a light) requires resources and has an effect on the environment. Many electric power plants burn coal, oil or natural gas in order to generate electricity for energy needs. While burning these fossil fuels produces a readily available and instantaneous supply of electricity, it also generates air pollutants including carbon dioxide (CO2), sulfur dioxide and trioxide (SOx) and nitrogen oxides (NOx). Carbon dioxide is an important greenhouse gas which is thought to be responsible for some fraction of the rapid increase in global warming seen especially in the temperature records in the 20th century, as compared with tens of thousands of years worth of temperature records which can be read from ice cores taken in Arctic regions. Burning fossil fuels for electricity generation also releases trace metals such as beryllium, cadmium, chromium, copper, manganese, mercury, nickel, and silver into the environment, which also act as pollutants.
The large-scale use of renewable energy technologies would "greatly mitigate or eliminate a wide range of environmental and human health impacts of energy use". Renewable energy technologies include biofuels, solar heating and cooling, hydroelectric power, solar power, and wind power. Energy conservation and the efficient use of energy would also help." [Energy industry. Environmental impact. Wikipedia]
The Energy resources diagram example was created in the ConceptDraw PRO diagramming and vector drawing software using the Manufacturing and Maintenance solution from the Illustration area of ConceptDraw Solution Park.
Infographics

 What are Infographic Area
Solutions of the area What is Infographics from ConceptDraw Solution Park collect templates, samples and vector stencils libraries with design elements for the drawing information graphics.
 Audit Flowcharts
Audit flowcharts solution extends ConceptDraw PRO software with templates, samples and library of vector stencils for drawing the audit and fiscal flow charts.
 Mechanical Engineering
This solution extends ConceptDraw PRO v.9 mechanical drawing software (or later) with samples of mechanical drawing symbols, templates and libraries of design elements, for help when drafting mechanical engineering drawings, or parts, assembly, pneumatic,
 Electrical Engineering
This solution extends ConceptDraw PRO v.9.5 (or later) with electrical engineering samples, electrical schematic symbols, electrical diagram symbols, templates and libraries of design elements, to help you design electrical schematics, digital and analog
 Business Process Workflow Diagrams
The Business Process Workflow Diagrams solution enhances the ConceptDraw PRO v10 functionality with predesigned examples, samples and a numerous collection of predesigned vector objects of workflow chart elements, icons, arrows, connectors, and varied wor
This ecology infographic example was created on the base of the infographics "Greenhouse gas emissions in the EU" from the Debating Europe website. [debatingeurope.eu/ wp-content/ uploads/ 2013/ 06/ TH_ 2_ social.png]
"A greenhouse gas (sometimes abbreviated GHG) is a gas in an atmosphere that absorbs and emits radiation within the thermal infrared range. This process is the fundamental cause of the greenhouse effect. The primary greenhouse gases in the Earth's atmosphere are water vapor, carbon dioxide, methane, nitrous oxide, and ozone. Greenhouse gases greatly affect the temperature of the Earth; without them, Earth's surface would average about 33 °C colder, which is about 59 °F below the present average of 14 °C (57 °F)." [Greenhouse gas. Wikipedia]
The ecology infographic example "EU greenhouse gas emissions" was created using the ConceptDraw PRO diagramming and vector drawing software extended with the Management Infographics solition from the area "Business Infographics" in ConceptDraw Solution Park.
Ecology infographics example

Used Solutions
 Fishbone Diagram
Fishbone Diagrams solution extends ConceptDraw PRO software with templates, samples and library of vector stencils for drawing the Ishikawa diagrams for cause and effect analysis.
The vector stencils library "Ecology pictograms" contains 20 ecological pictograms.
Use it to draw your eco illustrations, presentations, web pages and infographics.
The example "Design elements - Ecology pictograms" was created using the ConceptDraw PRO diagramming and vector drawing software extended with the Pictorial Infographic solution from the area "What is infographics" in ConceptDraw Solution Park.
Eco pictograms
- Mac viruses timeline - Infographics | Plant Layout Plans | Marketing ...
- Plant Layout Plans | Spatial Infographics | Simple Health Centre ...
- ConceptDraw Solution Park | Spatial Infographics | Plant Layout ...
- How to Create Infographics that Help People Eat Healthy | Plant ...
- ConceptDraw Solution Park | Business Infographics Area | Spatial ...
- Free Infographic Download
- Design elements - Ecology pictograms | Ecology pictograms - Vector ...
- Basic Flowchart Symbols and Meaning | Sales Process Flowchart ...
- Infographics Software Download Free
- Design elements - Ecology pictograms | Design Pictorial ...
- Electric Power Pictogram
- Design Pictorial Infographics . Design Infographics | Infographic ...
- Swot Infographics Free Downloads
- Map Infographic Maker | Sign Making Software | Brilliant Examples ...
- Spatial infographics Design Elements: Continental Map | How to ...
- Subway infographic design elements - software tools | Map ...
- Power Plants
- Wind Power Png
- Ecology pictograms - Vector stencils library | Ecology pictograms ...
- Ecology pictograms - Vector stencils library | How to Draw Pictorial ...