This site uses cookies. By continuing to browse the ConceptDraw site you are agreeing to our Use of Site Cookies.
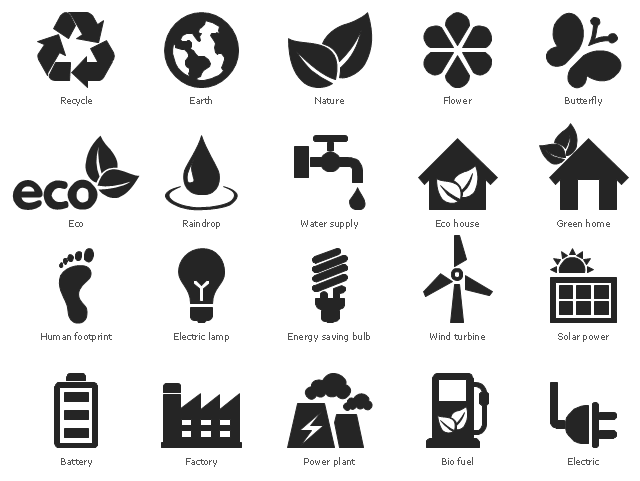
The vector stencils library "Ecology pictograms" contains 20 icons of eco symbols. Use it to draw your ecological infographics. The example "Ecology pictograms - Vector stencils library" was created using the ConceptDraw PRO diagramming and vector drawing software extended with the Pictorial infographics solution from the area "What is infographics" in ConceptDraw Solution Park.
Recycle
Recycle, recycle, ecology, utilization,
Nature
Nature, nature, vegetation,
Flower
Flower, flower,
Butterfly
Butterfly, butterfly,
Earth
Earth, earth, globe,
Raindrop
Raindrop, raindrop,
Water supply
Water supply, water tap, water supply,
Eco house
Eco house, eco house,
Green home
Green home, green home,
Electric
Electric, electric,
Electric lamp
Electric lamp, electric lamp,
Energy saving bulb
Energy saving bulb, energy saving bulb,
Factory
Factory, factory, industry, power plant,
Power plant
Power plant, power plant,
Battery
Battery, battery, accumulator,
Bio fuel
Bio fuel, bio fuel, charging station,
Wind turbine
Wind turbine, wind turbine, windmill,
Solar power
Solar power, solar power, solar panels,
Eco
Eco, eco,
Human footprint
Human footprint, footprint, human footprint,

How to Draw Pictorial Chart. How to Use Infograms

How to draw pictorial chart quick, easy and effective? ConceptDraw PRO offers the unique Pictorial Infographics Solution that will help you!
Pictorial Infographics solution contains large number of libraries with variety of predesigned vector pictograms that allows you design infographics in minutes. There are available 10 libraries with 197 vector pictograms.
The vector stencils library "Ecology pictograms" contains 20 ecological pictograms.
Use it to draw your eco illustrations, presentations, web pages and infographics.
The example "Design elements - Ecology pictograms" was created using the ConceptDraw PRO diagramming and vector drawing software extended with the Pictorial Infographic solution from the area "What is infographics" in ConceptDraw Solution Park.
Eco pictograms
Eco pictograms, wind turbine, windmill, water tap, water supply, solar power, solar panels, recycle, ecology, utilization, raindrop, power plant, nature, vegetation, green home, footprint, human footprint, flower, factory, industry, power plant, energy saving bulb, electric lamp, electric, eco house, eco, earth, globe, butterfly, bio fuel, charging station, battery, accumulator,

Energy Pyramid Diagram

Energy Pyramid Diagram is a visual graphical representation of the biomass productivity on the each trophic level in a given ecosystem. Its designing in ConceptDraw PRO will not take much time thanks to the unique Pyramid Diagrams solution from the Marketing area of ConceptDraw Solution Park.
Energy Pyramid Diagram begins from the producers (plants) and proceeds through a few trophic levels of consumers (herbivores which eat these plants, the carnivores which eat these herbivores, then carnivores which eat those carnivores, and so on) to the top of the food chain.

Design Pictorial Infographics. Design Infographics

In the course of recent decades data visualization went through significant development and has become an indispensable tool of journalism, business intelligence and science. The way visual information may be conveyed is not limited simply to static or dynamic representation, it can also be interactive. Infographics can be conditionally divided into several general levels. Primarily, this is level of visualization of information, its interpretation and association on any ground. Second level can be defined as a visualization of knowledge, depiction of thoughts and ideas in the form of images or diagrams. Finally, the level of data visualization, which processes data arrays in charts, enabling the information to be more clearly perceived. You can also identify the main approaches to the creation of infographics: exploratory and narrative. Exploratory method insists on minimalist design in favor of data precision without unnecessary details and is common for scientific researches and ana

Draw Flowcharts with ConceptDraw

Start design your own flowchart with ConceptDraw PRO and accomplish great results at the moment.

Geo Map of Americas

The Americas are the combined continental landmasses of North America and South America, in the Western Hemisphere. There are 35 sovereign states in the Americas.
ConceptDraw is idea to draw the geological maps of America from the pre-designed vector geo map shapes and vector images map of america.
Use Continent Maps solution from the Maps area of ConceptDraw Solution Park to draw thematic maps, geospatial infographics and vector illustrations for your business documents, presentations and websites.

Drawing a Nature Scene

ConceptDraw PRO is a drawings software for creating Nature scenes. Nature solution from ConceptDraw Solution Park expands this software with a new library that contains 17 vector objects and samples illustration files.

Infographic Maker

Infographic is a visual way of representing various information, data, knowledge in statistics, geography, journalism, education, and much more areas. ConceptDraw PRO supplied with Pictorial Infographics Solution from the “What are Infographics” Area, provides a set of powerful pictorial infographics tools. Thanks to them it is the best Infographic Maker.

Pictorial Chart

You want design Pictorial Chart or Infographic? And you need powerful infographic software? Then ConceptDraw PRO diagramming and vector drawing software extended with Pictorial Infographics Solution from the “What are Infographics” Area is exactly what you need.

draw area chart, draw area graph Area Charts

draw area chart, draw area graph
Area Charts are used to display the cumulative totals over time using numbers or percentages; or to show trends over time among related attributes. The Area Chart is effective when comparing two or more quantities. Each series of data is typically represented with a different color, the use of color transparency in an object’s transparency shows overlapped areas and smaller areas hidden behind larger areas.

Infographic Software

ConceptDraw PRO extended with Pictorial Infographics Solution from the “What are Infographics” Area is a powerful Infographic Software. Make sure in it right now!

How To Create a Bubble Chart

Bubble diagrams solution extends ConceptDraw PRO software with templates, Using ConceptDraw Connectors, you can create a bubble chart in moments.
Using ConceptDraw you will be able to create a bubble chart from the ready ConceptDraw library objects or make your own objects. The created diagram can represent ideas organization, in brainstorming processes, by teachers for explaining difficult ideas or for presentations.

Beauty of Event-driven Process Chain (EPC) diagrams

Event-Driven Process Chain Diagrams for improvement throughout an organisation.
ConceptDraw PRO - software that reduces the time needed to create a business process model.

Scatter Chart Examples

The Line Graphs solution from Graphs and Charts area of ConceptDraw Solution Park contains a set of examples, templates and design elements library of scatter charts.
Use it to draw scatter graphs using ConceptDraw PRO diagramming and vector drawing software for illustrating your documents, presentations and websites.