Line Chart Examples

Basic Diagramming


Pyramid Diagram

 Circle-Spoke Diagrams
Examples of subject areas that are well suited to this approach are marketing, business, products promotion, process modeling, market, resource, time, and cost analysis. Circle-Spoke Diagrams are successfully used in presentations, conferences, management documents, magazines, reportages, reviews, reports, TV, and social media.
This onion diagram sample was created on the base of the figure "Social Ecological Model (SEM)" illustrating the webpage "Cultural Competence" from the US Centers for Disease Control and Prevention (CDC) website.
"Why consider cultural competence?
It is important to communicate effectively to both the disparately affected population(s) of interest as well as other key stakeholders at the community, state, and national levels.
The diagram of the Social Ecological Model (SEM) ... depicts how health behaviors of an individual (inner oval) are influenced by the interpersonal, organizational, community, and public policy contexts and environment in which that person exists. Cultural context resides in the interpersonal band, making it a critical consideration when designing any communication plan. All obesity prevention communications should take the culture (e.g., language, thoughts, communications, actions, customs, beliefs, values, and institutions of racial, ethnic, religious, or social groups) of the target population into consideration to be effective. Interventions that successfully achieve this goal demonstrate cultural competence - behaviors, attitudes, and policies that come together in a system, agency, or among professionals to enable people to work effectively in a cross-cultural situation."
[cdc.gov/ obesity/ health_ equity/ culturalRelevance.html]
The onion diagram example "Social Ecological Model (SEM)" was created using the ConceptDraw PRO diagramming and vector drawing software extended with the Target and Circular Diagrams solution from the Marketing area of ConceptDraw Solution Park.
www.conceptdraw.com/ solution-park/ marketing-target-and-circular-diagrams
Onion diagram
---onion-diagram.png--diagram-flowchart-example.png)
"At the base of the identity of an organisational is its organizational culture. A culture is comprised of the shared values, customs, traditions, rituals, behaviours and beliefs shared by a social group (national, ethnic, organizational, etc.). Cultures also share languages, or ways of speaking. From a communication perspective, cultures are made and remade through the words we use to describe our world. Culture represents a common set of values (“shared meanings”), shared by members of a population, a organization, a project/ programme purpose unit or a profession (e.g., engineers versus scientists). Culture change with the times but the speed at which the culture of different institutions change varies widely." [Development Cooperation Handbook/ The development aid organization/ Organizational Culture. Wikibooks]
This organizational culture triangle diagram example derived from Parker and Benson's model. It's for explaination of the Regatta: Adoption Method.
The pyramid diagram example "Organizational culture" was redesigned using the ConceptDraw PRO diagramming and vector drawing software from Wikimedia Commons file Organization_ Triangle.png. [commons.wikimedia.org/ wiki/ File:Organization_ Triangle.png]
This file is licensed under the Creative Commons Attribution-Share Alike 2.5 Generic license. [creativecommons.org/ licenses/ by-sa/ 2.5/ deed.en]
The triangular chart sample "Organizational culture" is included in the Pyramid Diagrams solution from the Marketing area of ConceptDraw Solution Park.
Pyramid diagram

This circle-spoke diagram sample shows the social determinants of health. It was created on the base of the hub-and-spoke diagram from the Health Canada website. [hc-sc.gc.ca/ sr-sr/ pubs/ hpr-rpms/ bull/ 2005-climat/ 2005-climat-6-eng.php]
"Social determinants of health are the economic and social conditions – and their distribution among the population – that influence individual and group differences in health status. They are risk factors found in one's living and working conditions (such as the distribution of income, wealth, influence, and power), rather than individual factors (such as behavioural risk factors or genetics) that influence the risk for a disease, or vulnerability to disease or injury. According to some viewpoints, these distributions of social determinants are shaped by public policies that reflect the influence of prevailing political ideologies of those governing a jurisdiction. ...
In 2003, the World Health Organization (WHO) Europe suggested that the social determinants of health included:
(1) Social gradients (life expectancy is shorter and disease is more common further down the social ladder).
(2) Stress (including stress in the workplace).
(3) Early childhood development.
(4) Social exclusion.
(5) Unemployment.
(6) Social support networks.
(7) Addiction.
(8) Availability of healthy food.
(9) Availability of healthy transportation." [Social determinants of health. Wikipedia]
The hub-and-spoke diagram example "Social determinants of health" was created using the ConceptDraw PRO diagramming and vector drawing software extended with the Circle-Spoke Diagrams solution from the area "What is a Diagram" of ConceptDraw Solution Park.
Circle-spoke diagram

Geo Map — Asia

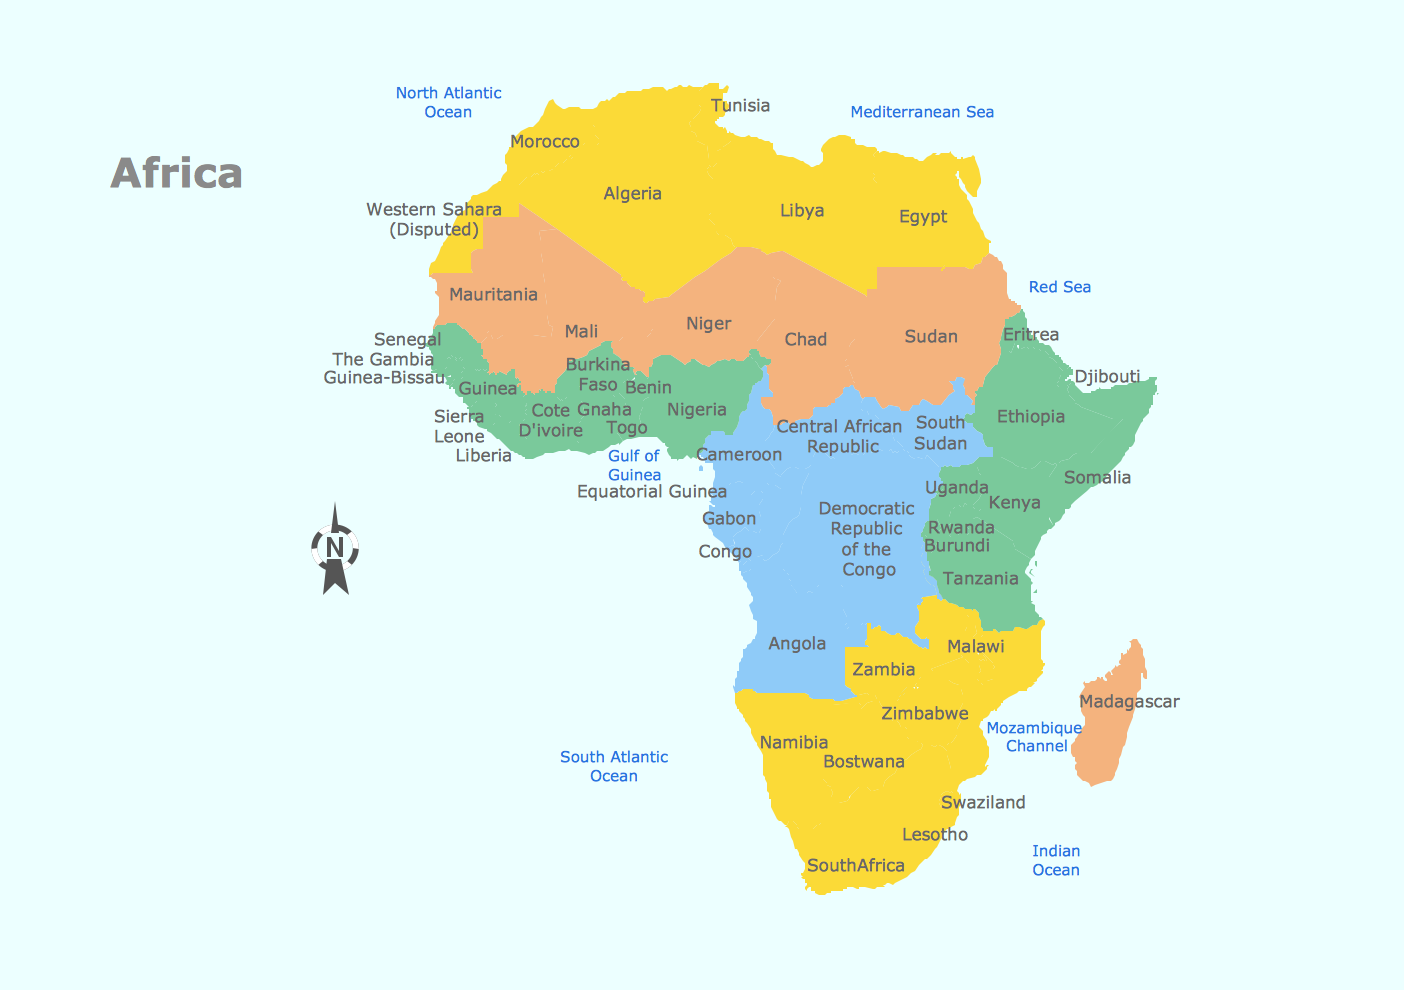
Geo Map - Africa
Area Chart

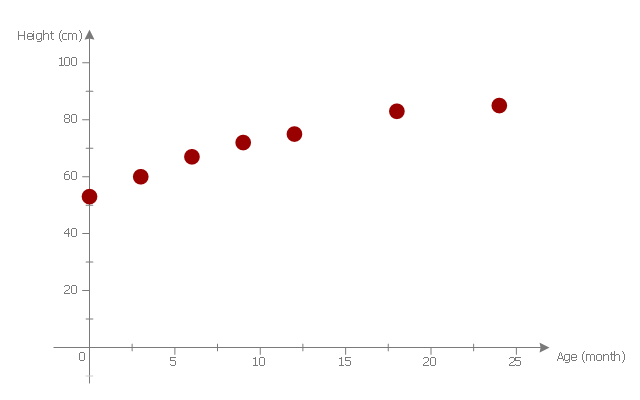
This scatter graph example visualize correlation between baby height and age.
"Human height is the distance from the bottom of the feet to the top of the head in a human body, standing erect. It is usually measured in centimetres when using the metric system, and feet and inches when using the imperial system. Human height has varied from under 60 centimetres (2 ft 0 in) to over 260 centimetres (8 ft 6 in). On average, males are taller than females. ...
Growth in stature, determined by its various factors, results from the lengthening of bones via cellular divisions chiefly regulated by somatotropin (human growth hormone (hGH)) secreted by the anterior pituitary gland. ...
The majority of linear growth occurs as growth of cartilage at the epiphysis (ends) of the long bones which gradually ossify to form hard bone. The legs compose approximately half of adult human height, and leg length is a somewhat sexually dimorphic trait. Some of this growth occurs after the growth spurt of the long bones has ceased or slowed. The majority of growth during growth spurts is of the long bones. Additionally, the variation in height between populations and across time is largely due to changes in leg length. The remainder of height consists of the cranium. Height is sexually dimorphic and statistically it is more or less normally distributed, but with heavy tails." [Human height. Wikipedia]
The scatter plot example "Baby height by age" was created using the ConceptDraw PRO diagramming and vector drawing software extended with the Scatter Diagrams solution from the Graphs and Charts area of ConceptDraw Solution Park.
Scatter diagram
Pictures of Graphs

 USA Maps
Use the USA Maps solution to create a map of USA, a US interstate map, printable US maps, US maps with cities and US maps with capitals. Create a complete USA states map.
How To use House Electrical Plan Software


- Diagrams Of Population
- Social Population Diagram
- Very Easy Diagram On Population
- Regional population growth from 2010 to 2016 | Basic Diagramming ...
- Population Growth Flow Diagram
- Basic Diagramming | Line Chart Examples | Pyramid Diagram ...
- Population Bar Diagram
- Line Chart Examples | Infographic Maker | Pyramid Diagram ...
- Saturated fats in the U.S. population diet | Catabolism schematic ...
- Population 2016 Flow Chart
- Population Data And Sample Data
- Population Education Pictures Chart Making
- Population Explosion Flow Chart
- Regional population growth from 2010 to 2016 | Competitor Analysis ...
- Population Flow Chart Or Diagram Images
- Population Types Flowchart
- Scatter Plot On Us Population
- Population In Each Continent In Bar Diagram
- Example Of Chart Diagram Of Showing World Population