HelpDesk
How to Edit Grouped Shapes in ConceptDraw PRO on Windows
ConceptDraw PRO allows one to group objects. Grouping shapes, pictures, or objects lets you style, format, rotate, and move them together, as though they were a single object. At the same time, you can edit each of them separately.HelpDesk
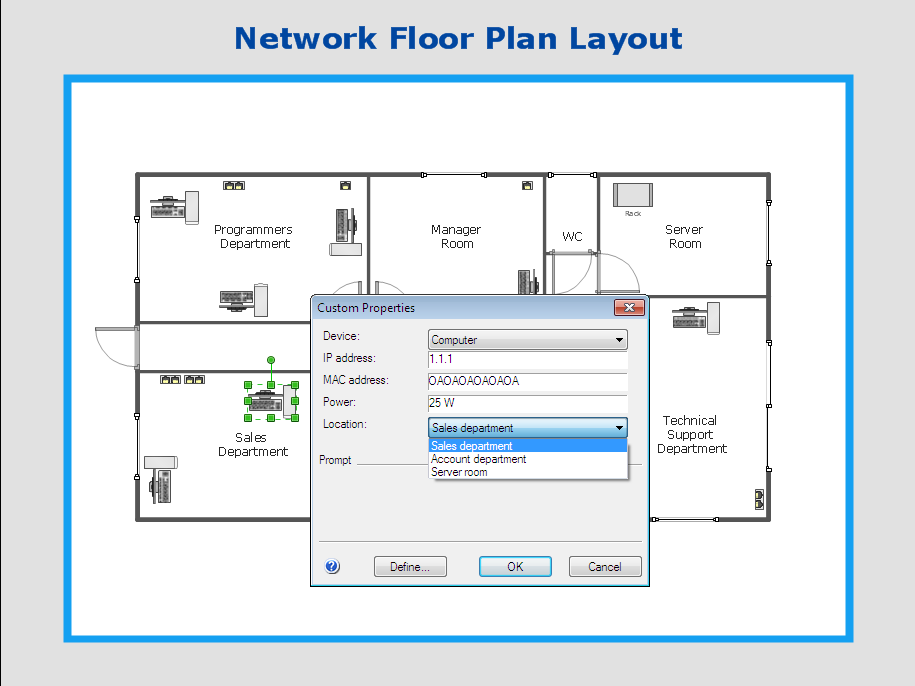
How to Work with Custom Properties in ConceptDraw PRO on PC
ConceptDraw PRO can store additional, user-defined data that can be assigned to a particular shape. This data is stored in the Custom Properties options.HelpDesk
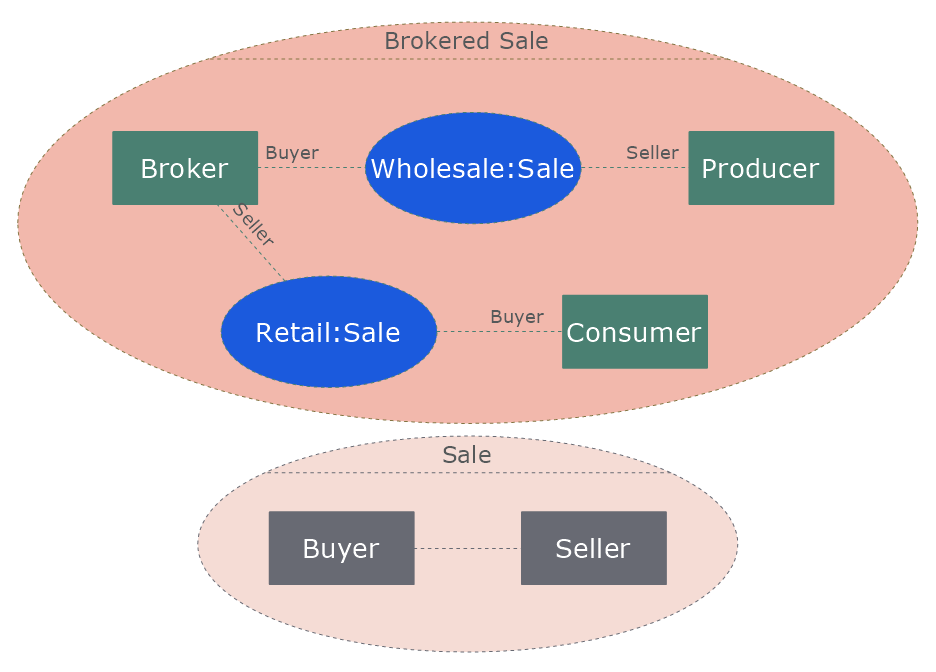
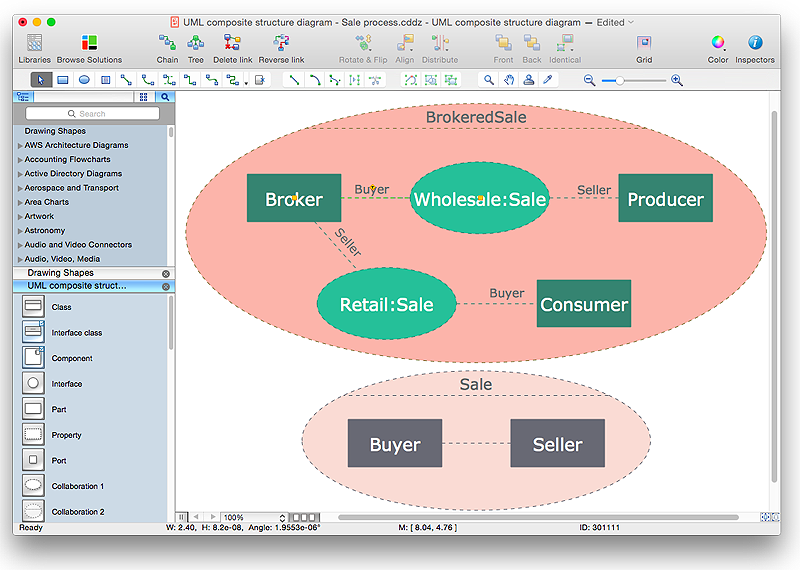
How to Edit Grouped Shapes in ConceptDraw PRO on OS X
ConceptDraw PRO offers a range of built-in facilities in order to enable you to quickly edit any diagram or other visualization made using ConceptDraw PRO, or MS Visio. Grouping shapes, pictures, or objects lets you style, format, rotate, and move them together, as though they were a single object.HelpDesk
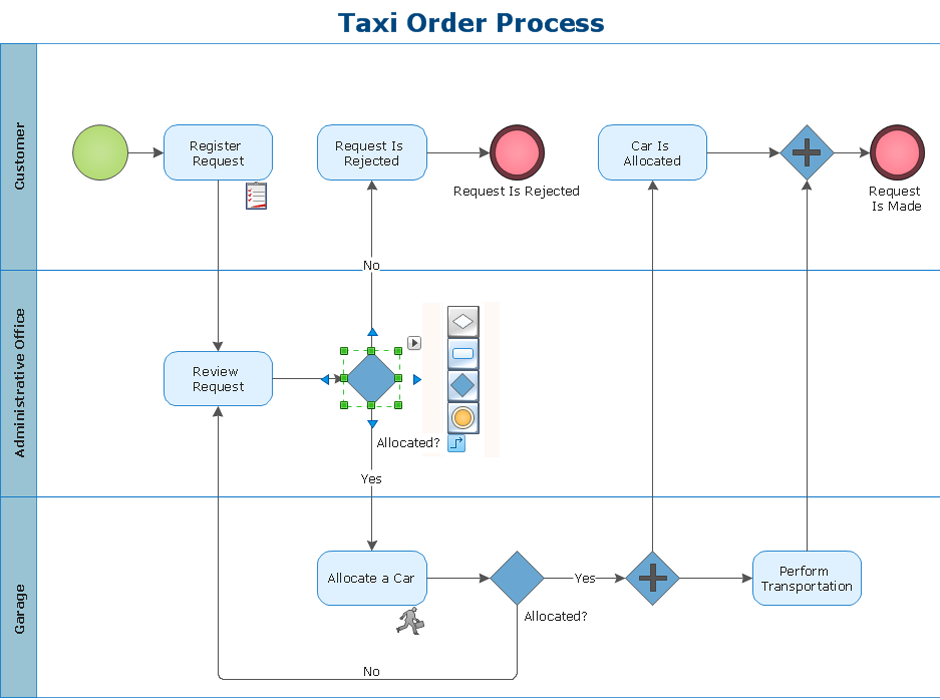
How to Make a Rapid Draw Object in ConceptDraw PRO
The Rapid Draw technology is an automatic drawing system. It is designed to significantly reduce the time of creating flowcharts and diagrams. Especially those, consisting from some typical entities. You can extend the standard ConceptDraw PRO object libraries with new objects by customizing any item from any library and assigning it with Rapid Draw features. You can quickly create and edit complex drawings using Rapid Draw technology and your self-created objects.HelpDesk
How to Resize Objects in ConceptDraw PRO
When creating diagram using ConceptDraw PRO, you can select, move, resize and rotate objects. After selecting an object (or objects) in a document, you can change it position, resize it or move an object to the desired position. The sizes of objects in ConceptDraw PRO can be changed by simple dragging, or you can set a particular size of any object. Using ConceptDraw PRO, you can re-size an object on the page using the absolute measurements instead of a mouse. You can make quick work of designing complex drawing using a combination of different-sized items.HelpDesk
How to Start Drawing a Diagram on Mac
In this tutorial we will explain how to create a simple chart in ConceptDraw PRO using a template, and how to use the library objects.HelpDesk
How to Draw Geometric Shapes in ConceptDraw PRO
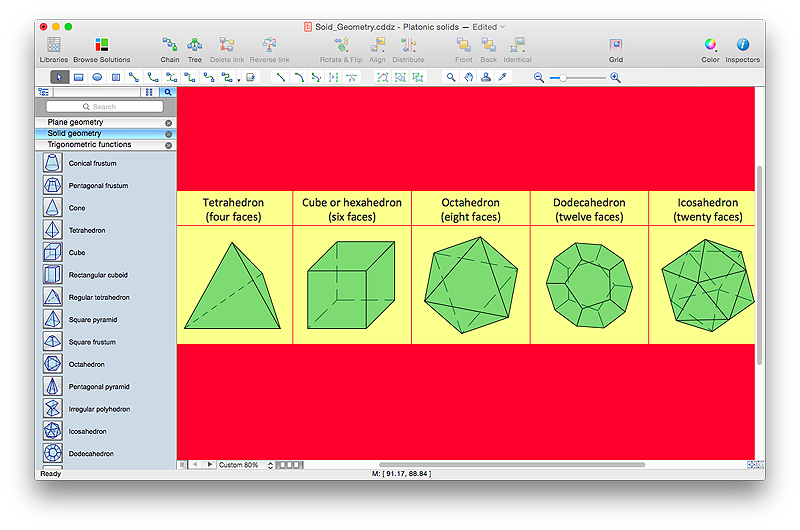
Knowledge of geometry grants people good logic, abstract and spatial thinking skills. The object of study of geometry are the size, shape and position, the 2-dimensional and 3-dimensional shapes. Geometry is related to many other areas in math, and is used daily by engineers, architects, designers and many other professionals. Today, the objects of geometry are not only shapes and solids. It deals with properties and relationships and looks much more about analysis and reasoning. Geometry drawings can be helpful when you study the geometry, or need to illustrate the some investigation related to geometry. ConceptDraw PRO allows you to draw plane and solid geometry shapes quickly and easily.
 Value Stream Mapping
Value stream mapping solution extends ConceptDraw PRO software with templates, samples and vector stencils for drawing the Value Stream Maps (VSM) in lean manufacturing practice.
The vector stencils library "Picture Graphs" contains 35 templates of picture bar graphs for visual data comparison and time series.
Drag a template from the library to your document, set bars number, type category labels, select bars and enter your data.
Use these shapes to draw your pictorial bar charts in the ConceptDraw PRO diagramming and vector drawing software.
The vector stencils library "Picture Graphs" is included in the Picture Graphs solution from the Graphs and Charts area of ConceptDraw Solution Park.
HelpDesk
How to Create an Accounting Flowchart Using ConceptDraw Solution Park
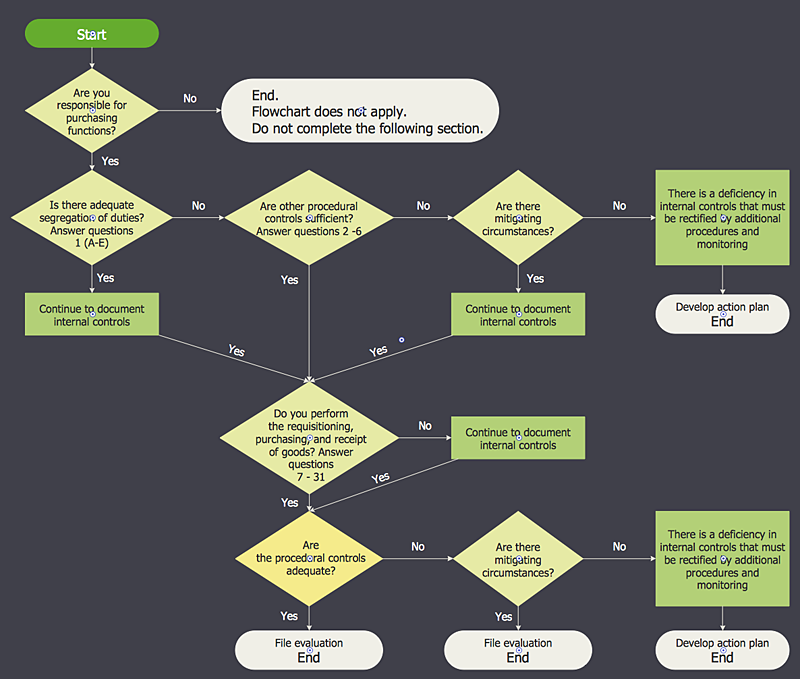
An Accounting flowchart is a specialized type of flowchart. With the help of an accounting flowchart you can visually describe tasks, documents, people responsible for execution at each stage of accounting workflow. Find out how you can easily create an accounting flowchart of any complexity using Accounting Flowchart Solution from the ConceptDraw Solution Park.HelpDesk
How to Draw a Line Chart Quickly
A common line chart is a graphical representation of the functional relationship between two series of data. A line chart that is created by connecting a series of data points together with a straight line is the most basic type of a line chart. A line chart can be used for depicting data that changes continuously over time. It is extensively utilized in statistics, marketing and financial business. ConceptDraw Line Graph solution provides the possibility to make 2D line charts quickly and effortlessly.HelpDesk
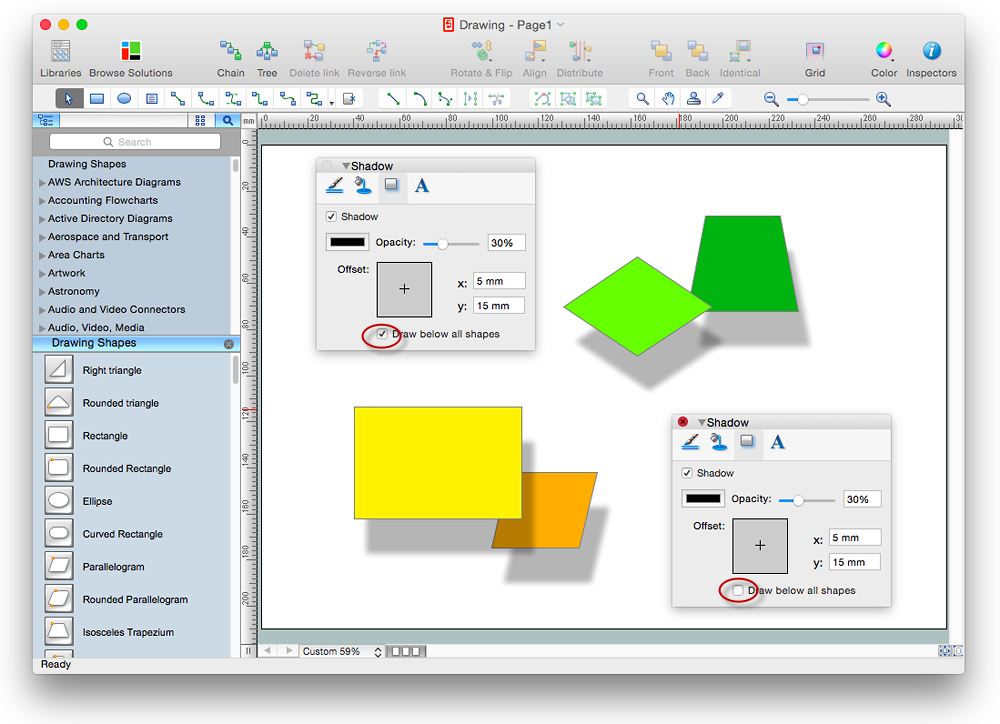
How to Edit Drawing Using Shadows in ConceptDraw PRO
Tips on how to apply shadow to objects in the ConcepDraw drawingHelpDesk
How to Create a Bar Chart in ConceptDraw PRO
Bar charts (bar graphs) are diagrams displaying data as horizontal or vertical bars of certain heights. Bar charts are widely used to show and compare the values of the same parameters for different data groups. The bar graph can be vertical or horizontal. This depends on the amount of categories. There are many methods in which bar graph can be built and this makes it a very often used chart type. Usually, a bar chart is created so that the bars are placed vertically. Such arrangement means that the bar's height value is proportional to the category value. Nevertheless, a bar chart can be also drawn horizontally. This means that the longer the bar, the bigger the category. Thus, a bar chart is a good way to present the relative values of different measured items. The ConceptDraw Bar Graphs solution allows you to draw a bar chart quickly using a vector library, containing the set of various bar charts objects.HelpDesk
How to Draw a Pyramid Diagram in ConceptDraw PRO
Pyramid diagram (triangle diagram) is used to represent data, which have hierarchy and basics. Due to the triangular form of diagram, each pyramid section has a different width. The width of the segment shows the level of its hierarchy. Typically, the top of the pyramid is the data that are more important than the base data. Pyramid scheme can be used to show proportional and hierarchical relationships between some logically related items, such as departments within an organization, or successive elements of any process. This type of diagram is often used in marketing to display hierarchical related data, but it can be used in a variety of situations. ConceptDraw PRO allows you to make a pyramid diagram, quickly and easily using special libraries.- Picture Graphs | Design elements - Picture graphs | How to Create a ...
- Picture Graphs | Universal Diagramming Area | Network Diagram ...
- Telecommunication Network Diagrams | Design elements ...
- Picture Graphs | Flowchart Example: Flow Chart of Marketing ...
- Pictures Of Algorithm And Flowchart
- Easy Flowchart
- Design elements - Picture graphs | ConceptDraw Solution Park ...
- Basic Flowchart Symbols and Meaning | Flowchart design ...
- Bar Graphs | Bar Chart Software | How to Create a Bar Chart in ...
- Basic Flowchart Images . Flowchart Examples | Basic Audit Flowchart ...
- Total value of manufacturers' shipments - Arrow graph | Bar Chart ...
- Network diagrams with ConceptDraw PRO | Picture Graphs | Active ...
- People | Cisco People. Cisco icons, shapes , stencils and symbols ...
- Design elements - Picture graphs | Picture graph template | Picture ...
- Picture Graphs | Line Graphs | Bar Graphs | Graphs
- How to Draw a Pictorial Chart in ConceptDraw PRO | Sample ...
- How to Draw a Pictorial Chart in ConceptDraw PRO | Sample ...
- Picture graph - Population growth by continent, 2010 - 2013 | Picture ...
- Basic Diagramming | Picture Graphs | Create Graphs and Charts ...
- Design elements - Picture graphs | Picture graphs - Vector stencils ...
