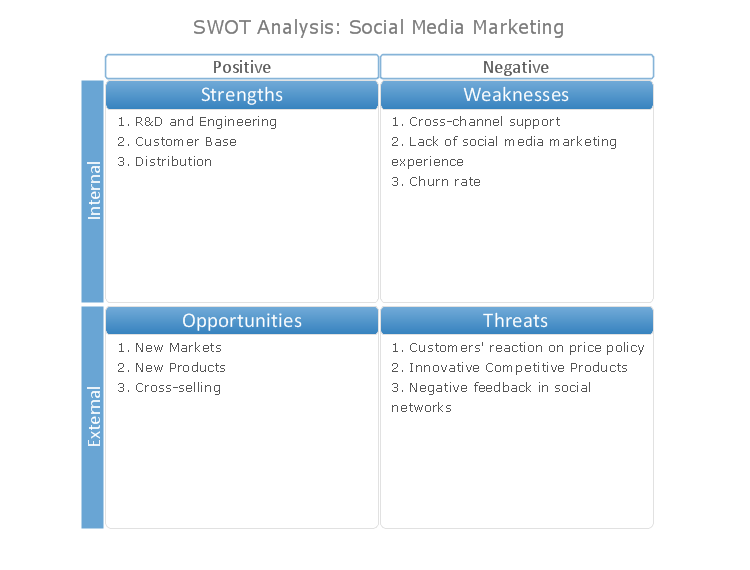
SWOT Matrix Blue Theme
How to Draw a Good Diagram of a Business Workflow?

PDPC

Pie Chart Software

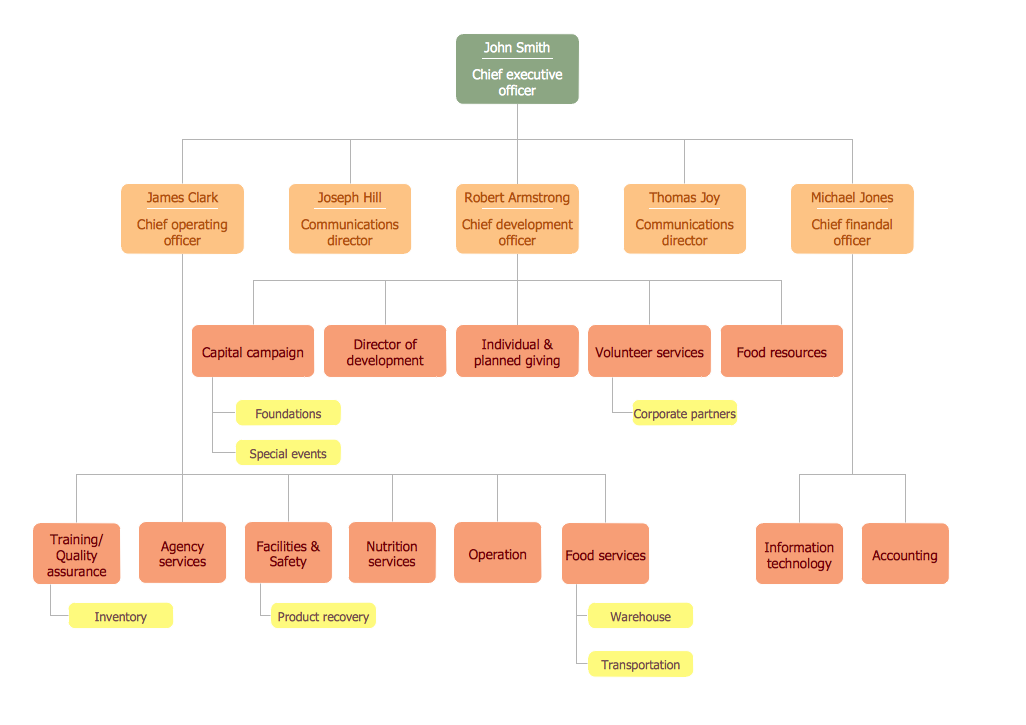
Business Board Org Chart

Total Quality Management with ConceptDraw

Organigrams with ConceptDraw DIAGRAM
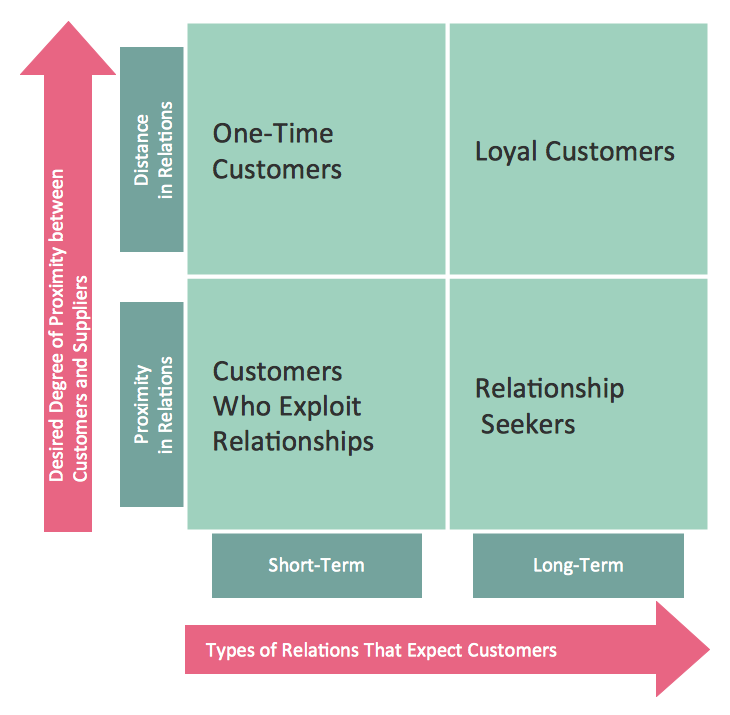
Matrices
Human Resource Development

Use the Best FlowChart Tool for the Job

HR Management Software

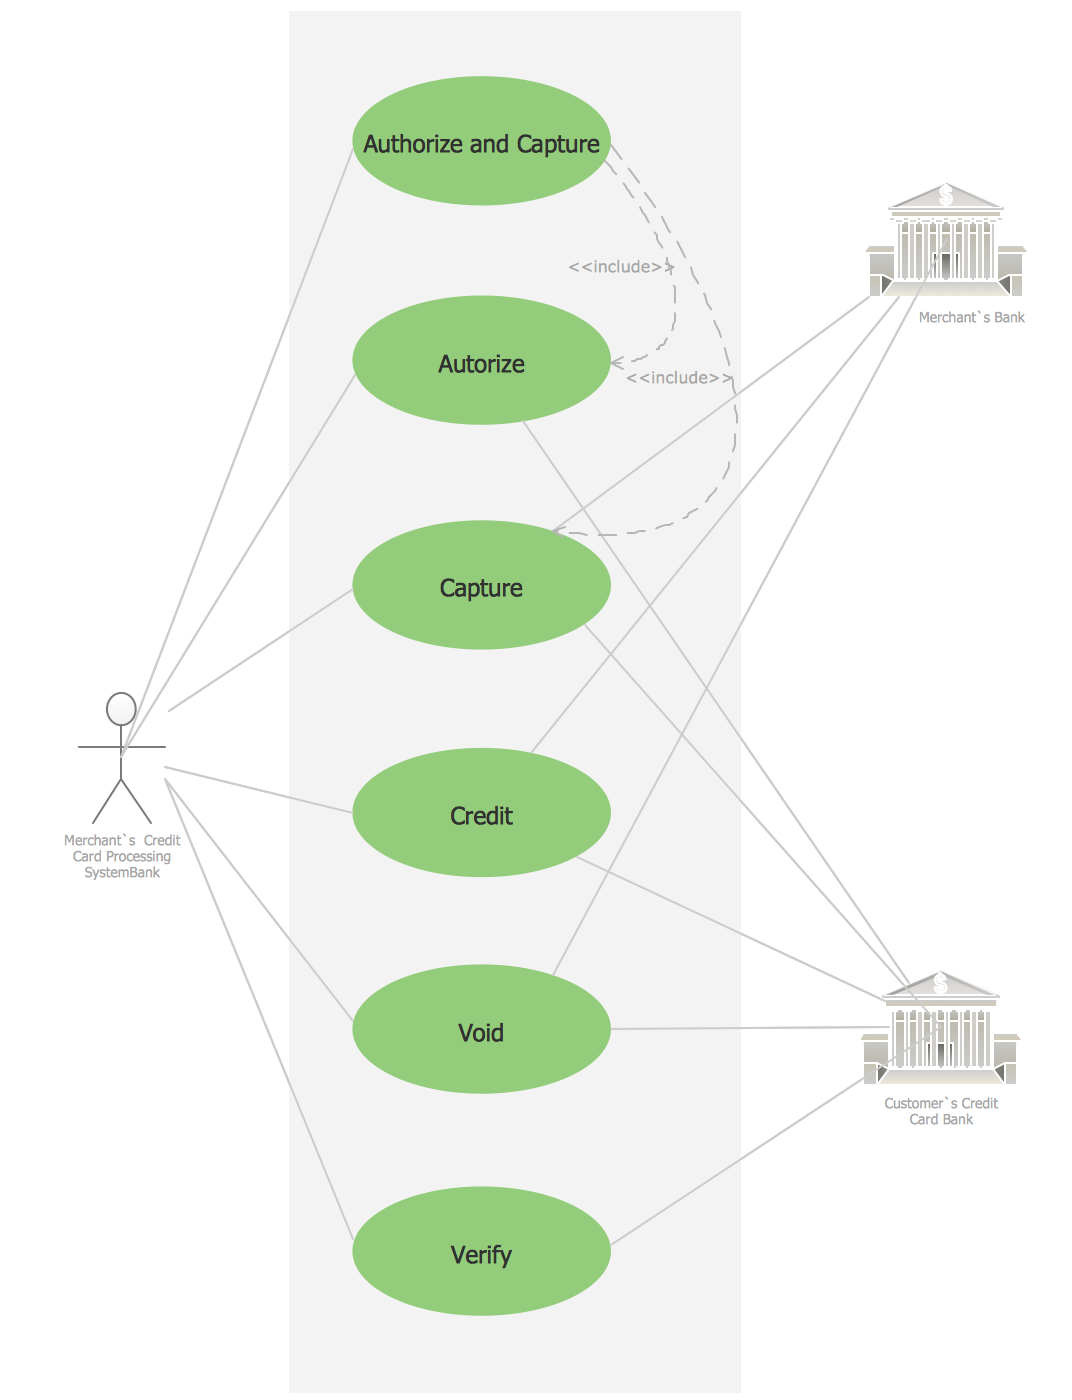
Credit Card Processing System UML Diagram
How To Make a Bubble Chart

 Fault Tree Analysis Diagrams
This solution extends ConceptDraw DIAGRAM.5 or later with templates, fault tree analysis example, samples and a library of vector design elements for drawing FTA diagrams (or negative analytical trees), cause and effect diagrams and fault tree diagrams.
ConceptDraw DIAGRAM Compatibility with MS Visio

- Personal Swot Analysis Examples For Marekting Job
- Hr Personal Swot Analysis
- Swot Analysis Example Job
- Individual Swot Analysis
- Territory Swot Analysis Chart
- SWOT analysis matrix diagram templates | Lead to opportunity sales ...
- How to Create SWOT Analysis Template Using ConceptDraw PRO ...
- Use the Best FlowChart Tool for the Job | Swot Analysis Examples ...
- Sample Of A Swot Analysis Template Of A Personal Need
- SWOT Analysis | SWOT and TOWS Matrix Diagrams | SWOT Matrix ...
- Hotel Swot Analysis Pdf
- HR workflow - Vector stencils library | SWOT Matrix Template ...
- HR workflow - Vector stencils library | SWOT analysis matrix diagram ...
- SWOT Analysis | SWOT analysis matrix diagram templates | SWOT ...
- Hiring process workflow | 25 Typical Orgcharts | HR Flowcharts ...
- SWOT Analysis | SWOT Analysis Solution - Strategy Tools | How to ...
- Personal Matrix
- SWOT analysis matrix diagram templates | Software for Creating ...
- Er Diagram For Personal Investment Management System
- HR workflow - Vector stencils library | Personal area (PAN) networks ...