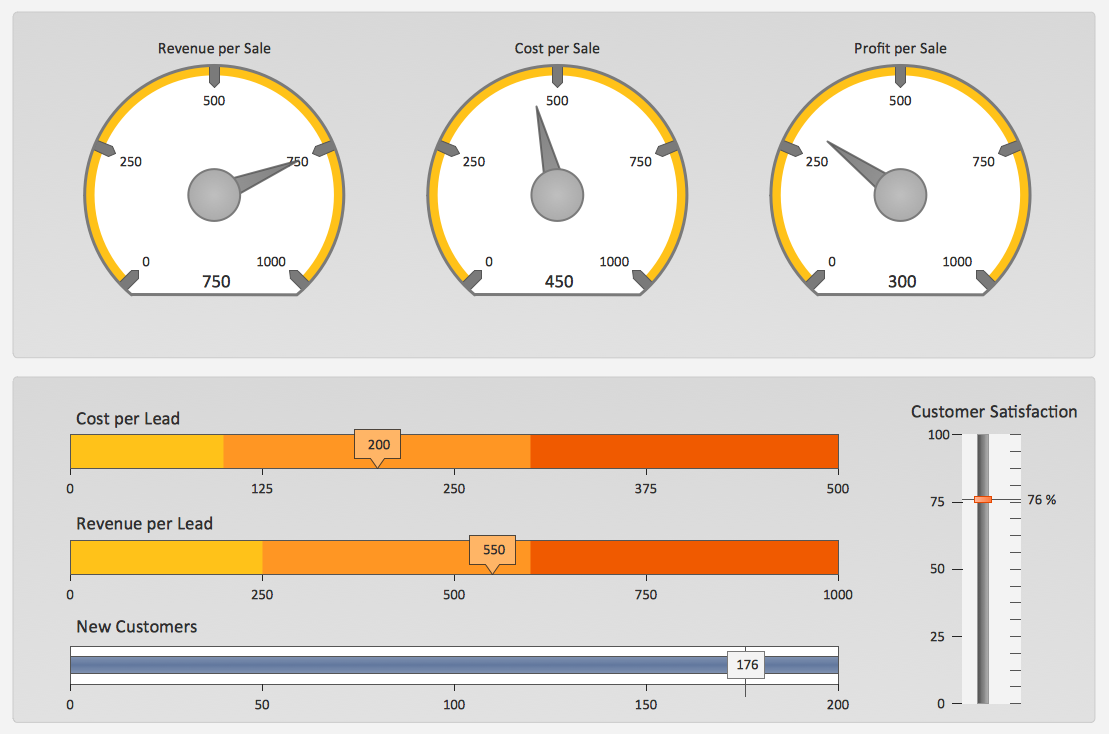
Sales KPI Dashboards
 Logistic Dashboard
The powerful tools of Logistic Dashboard solution and specially developed live graphic objects of logistic icons, logistic navigation elements, logistic indicators, logistic charts and logistic maps effectively assist in designing Logistic dashboards, Logistic maps, Logistic charts, diagrams and infographics. The included set of prebuilt samples and quick-start templates, demonstrates the power of ConceptDraw DIAGRAM software in logistics management, its assisting abilities in development, realization and analyzing the logistic processes, as well as in perfection the methods of logistics management.
Performance Indicators

Sales Dashboard Solutions can help your sales team keep an eye on performance

This example was created on the base of the Georgia DOT Performance Management Dashboard from the Georgia Department of Transportation website.
[dot.ga.gov/ informationcenter/ statistics/ performance/ Pages/ default.aspx]
"Performance management (PM) includes activities which ensure that goals are consistently being met in an effective and efficient manner. Performance management can focus on the performance of an organization, a department, employee, or even the processes to build a product of service, as well as many other areas.
PM is also known as a process by which organizations align their resources, systems and employees to strategic objectives and priorities.
Performance management originated as a broad term coined by Dr. Aubrey Daniels in the late 1970s to describe a technology (i.e. science imbedded in applications methods) for managing both behavior and results, two critical elements of what is known as performance. A formal definition of performance management, according to Daniels' is "a scientifically based, data-oriented management system. It consists of three primary elements-measurement, feedback and positive reinforcement."" [Performance management. Wikipedia]
The meter dashboard example "Georgia DOT Performance Management" was created using the ConceptDraw PRO diagramming and vector drawing software extended with the Meter Dashboard solution from the area "What is a Dashboard" of ConceptDraw Solution Park.
Meter dashboard

Sales Dashboards for Your Company
Constant improvement of key performance indicators
 Entity-Relationship Diagram (ERD)
An Entity-Relationship Diagram (ERD) is a visual presentation of entities and relationships. That type of diagrams is often used in the semi-structured or unstructured data in databases and information systems. At first glance ERD is similar to a flowch
Competitor Analysis

 SYSML
SYSML
The SysML solution helps to present diagrams using Systems Modeling Language; a perfect tool for system engineering.
- Logistics Performance Dashboard - Template | Sales KPIs ...
- KPI Dashboard | KPIs and Metrics | Business Graphics Software ...
- KPI Dashboard | Business Graphics Software | TQM Diagram ...
- Constant improvement of key performance indicators | Total Quality ...
- Georgia DOT performance management - Meter dashboard ...
- Sales Performance | Sales Process Map | Sales Growth. Bar Graphs ...
- Dashboard | What is a KPI ? | How to Create a Sales Dashboard ...
- Status Dashboard | Design elements - Status indicators | Status ...
- Design elements - Meter indicators | Georgia DOT performance ...
- Website traffic dashboard | Website KPIs - Visual dashboard ...