Flowchart Programming Project. Flowchart Examples

Technical Flow Chart Example

Swim Lane Flowchart Symbols

Hybrid Network Topology

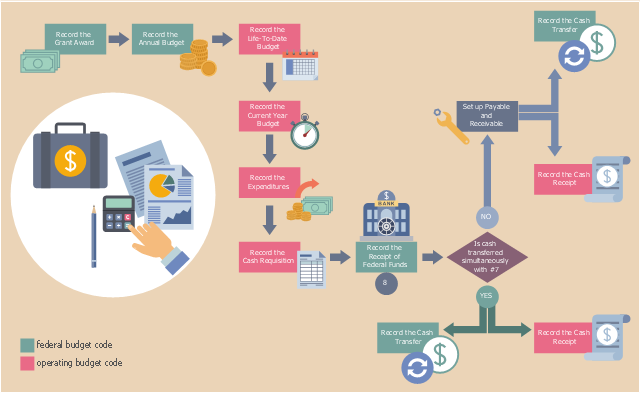
This example was designed on the base of the workflow diagram from the North Carolina Office of the State Controller website. [osc.nc.gov/ sigdocs/ sig_ docs/ documentation/ policies_ procedures/ flow.html]
"Grants are non-repayable funds or products disbursed by one party (grant makers), often a government department, corporation, foundation or trust, to a recipient, often (but not always) a nonprofit entity, educational institution, business or an individual. In order to receive a grant, some form of "Grant Writing" often referred to as either a proposal or an application is required. ...
Most grants are made to fund a specific project and require some level of compliance and reporting. The grant writing process involves an applicant submitting a proposal (or submission) to a potential funder, either on the applicant's own initiative or in response to a Request for Proposal from the funder. Other grants can be given to individuals, such as victims of natural disasters or individuals who seek to open a small business. Sometimes grant makers require grant seekers to have some form of tax-exempt status, be a registered nonprofit organization or a local government. ...
Project-related funding involving business, communities, and individuals is often arranged by application either in writing or online." [Grant (money). Wikipedia]
The workflow diagram example "Grant Accounting: business process flow" was created using ConceptDraw PRO software extended with the Business Process Workflow Diagrams solution from the Business Processes area of ConceptDraw Solution Park.
Workflow diagram
ConceptDraw DIAGRAM ER Diagram Tool

Network Diagram Software Logical Network Diagram


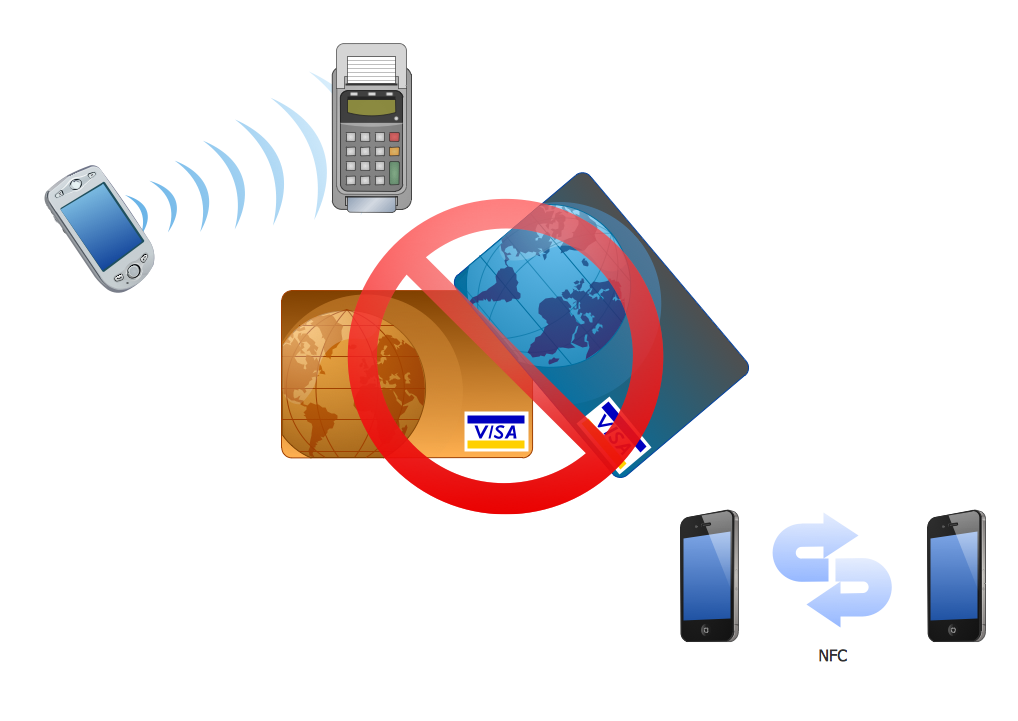
Near field communication (NFC). Computer and Network Examples
How to Discover Critical Path on a Gantt Chart

Technical Flow Chart

- UML Flowchart Symbols | Pencil Project Sample Gui
- PM Response | ConceptDraw Arrows10 Technology | Pencil Entity ...
- How To Make Electrical Plan Using Pencil Project
- Pencil Er Diagram
- Draw All Network Topology With Pencil
- Disaster Management Pensil Diagrams
- Pencil Network Symbols
- Pencil Network Stencils
- Flowchart To Buy A Pencil
- Pencils Manufacturing Process Chart