 Circular Arrows Diagrams
Circular Arrows Diagrams solution extends ConceptDraw PRO v10 with extensive drawing tools, predesigned samples, Circular flow diagram template for quick start, and a library of ready circular arrow vector stencils for drawing Circular Arrow Diagrams, Segmented Cycle Diagrams, and Circular Flow Diagrams. The elements in this solution help managers, analysts, business advisers, marketing experts, scientists, lecturers, and other knowledge workers in their daily work.
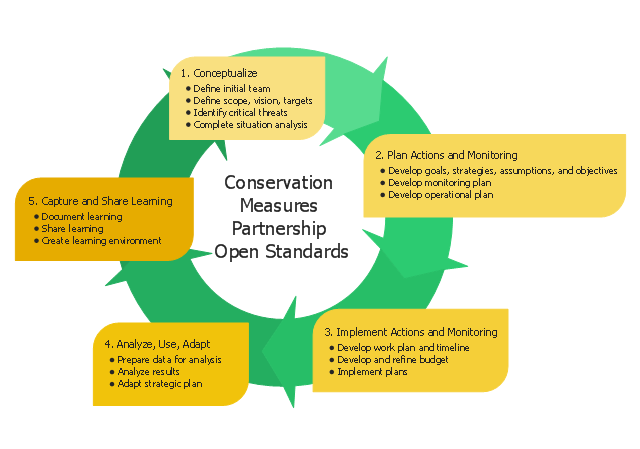
This circular arrows diagram sample shows five steps of the Conservation Measures Partnership (CMP) adaptive management cycle. It was designed on the base of the Wikimedia Commons file: CMP Cycle - 2008-02-20.jpg.
[commons.wikimedia.org/ wiki/ File:CMP_ Cycle_ -_ 2008-02-20.jpg]
"Adaptive management (AM), also known as adaptive resource management (ARM), is a structured, iterative process of robust decision making in the face of uncertainty, with an aim to reducing uncertainty over time via system monitoring. In this way, decision making simultaneously meets one or more resource management objectives and, either passively or actively, accrues information needed to improve future management. Adaptive management is a tool which should be used not only to change a system, but also to learn about the system. Because adaptive management is based on a learning process, it improves long-run management outcomes. The challenge in using the adaptive management approach lies in finding the correct balance between gaining knowledge to improve management in the future and achieving the best short-term outcome based on current knowledge.
Application to environmental projects and programs.
Open Standards for the Practice of Conservation lay out 5 main steps to an adaptive management project cycle." [Adaptive management. Wikipedia]
The diagram example "CMP adaptive management cycle" was created using the ConceptDraw PRO diagramming and vector drawing software extended with the Circular Arrows Diagrams solution from the area "What is a Diagram" of ConceptDraw Solution Park.
Circular arrows diagram
Used Solutions
This SWOT matrix diagram example was created on the base of article "An Easy Way To Jumpstart Your Strategic Plan: SWOT" by Leslie Wolf from the website of the California Digital Library, the University of California. "Strategic planning doesn’t have to be a daunting and lengthy process. The goal is really a simple one: to help you understand your world and build a road map to guide your efforts. ...
This analysis tool can help you focus your attention on the specific success factors that are right for your team.
The tool is called a SWOT analysis. SWOT stands for Strengths and Weaknesses, Opportunities and Threats. Here’s what it means:
(1) Strengths are those positive internal attributes that strengthen your business or team. You can develop plans to capitalize on those strengths.
(2) Weaknesses are those negative internal attributes that are working against your success. You can shore up those weaknesses so they don’t stop your success.
(3) Opportunities are those external conditions that can have a positive effect on your goals. These opportunities can point you in the right direction.
(4) Threats are those external conditions that can have a negative effect on your goals. These threats will affect you less if you can identify and minimize them. ...
We thought it would be helpful to show you a sample SWOT analysis for a business you can easily visualize: a small independent bookstore in a university town. The store owner brought the team together to think about how the bookstore could survive during the continuing financial downturn. After an hour of brainstorming, this is the SWOT analysis they developed." [cdlib.org/ cdlinfo/ 2010/ 09/ 29/ an-easy-way-to-jumpstart-your-strategic-plan-swot/ ]
The matrix diagram example "SWOT analysis for a small independent bookstore" was created using the ConceptDraw PRO diagramming and vector drawing software extended with the SWOT Analysis solution from the Management area of ConceptDraw Solution Park.
SWOT matrix

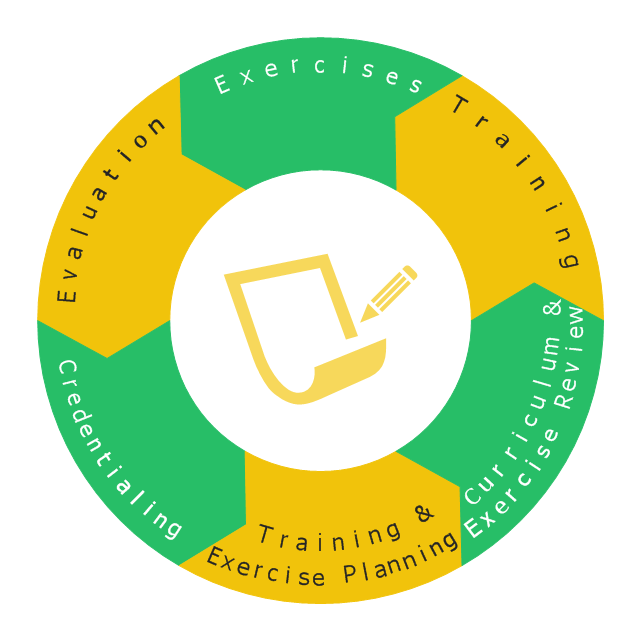
This wheel diagram sample illustrates the emergency preparedness training and exercise processes. It was designed on the base of the diagram on the webpage "Public Health Preparedness Training and Exercise" from the FloridaHealth website of the Florida Department of Health. [floridahealth.gov/ programs-and-services/ emergency-preparedness-and-response/ training-exercise/ ]
"Emergency Preparedness is the discipline of dealing with and avoiding both natural and manmade disasters. It involves mitigation, preparedness, response and recovery in order to lessen the impact of disasters. Emergency management requires a partnership among all levels of government (local, State, and Federal) and the private sector (business and industry, voluntary organizations, and the public). Successful preparedness requires detailed planning and cooperation among each sector." [Emergency Preparedness. Wikipedia]
The arrow donut chart example "Training and exercise process wheel" was created using the ConceptDraw PRO diagramming and vector drawing software extended with the Circular Arrows Diagrams solution from the area "What is a Diagram" of ConceptDraw Solution Park.
Circular arrows diagram
Used Solutions
"General packet radio service (GPRS) is a packet oriented mobile data service on the 2G and 3G cellular communication system's global system for mobile communications (GSM). GPRS was originally standardized by European Telecommunications Standards Institute (ETSI) in response to the earlier CDPD and i-mode packet-switched cellular technologies. It is now maintained by the 3rd Generation Partnership Project (3GPP).
GPRS usage is typically charged based on volume of data transferred, contrasting with circuit switched data, which is usually billed per minute of connection time. Usage above the bundle cap is either charged per megabyte or disallowed.
GPRS is a best-effort service, implying variable throughput and latency that depend on the number of other users sharing the service concurrently, as opposed to circuit switching, where a certain quality of service (QoS) is guaranteed during the connection. In 2G systems, GPRS provides data rates of 56–114 kbit/ second. 2G cellular technology combined with GPRS is sometimes described as 2.5G, that is, a technology between the second (2G) and third (3G) generations of mobile telephony. It provides moderate-speed data transfer, by using unused time division multiple access (TDMA) channels in, for example, the GSM system. GPRS is integrated into GSM Release 97 and newer releases." [General Packet Radio Service. Wikipedia]
This GPRS network diagram example was created using the ConceptDraw PRO diagramming and vector drawing software extended with the Telecommunication Network Diagrams solution from the Computer and Networks area of ConceptDraw Solution Park.
GPRS network diagram

 Organizational Charts
Organizational Charts solution extends ConceptDraw PRO software with samples, templates and library of vector stencils for drawing the org charts.
- Workflow Diagrams | Organigrams with ConceptDraw PRO | Entity ...
- Tree Diagram And Charts Of Partnership Firm Process And Procedure
- Entity-Relationship Diagram (ERD) | Stakeholder Onion Diagrams ...
- Partnership Firm Process And Procedure For Diagram And Chart
- Partnership Diagrams
- Organizational Chart For Partnership
- Partnership Business Structure Free Drawing
- Importance Of Partnership Firm By Diagrams Nd Graphs
- Entity-Relationship Diagram (ERD) | SWOT Analysis | Orgchart ...
- Methodology Of Partnership Firm
- Pie Diagram For Partnership Firm
- Partnership Organizational Chart Template
- Partnership Deed Defain By Chart
- SWOT Analysis | Entity-Relationship Diagram (ERD) | SWOT Matrix ...
- Sample General Partnership Organizational Chart
- A Sample Organogram For A Partnership Business
- Partnership Organisation Diagram Explained
- Example Of A Partnership Organogram
- Data Analysis And Interpretation Of Partnership Firm