Fishbone Diagram Example

Create Organizational Chart
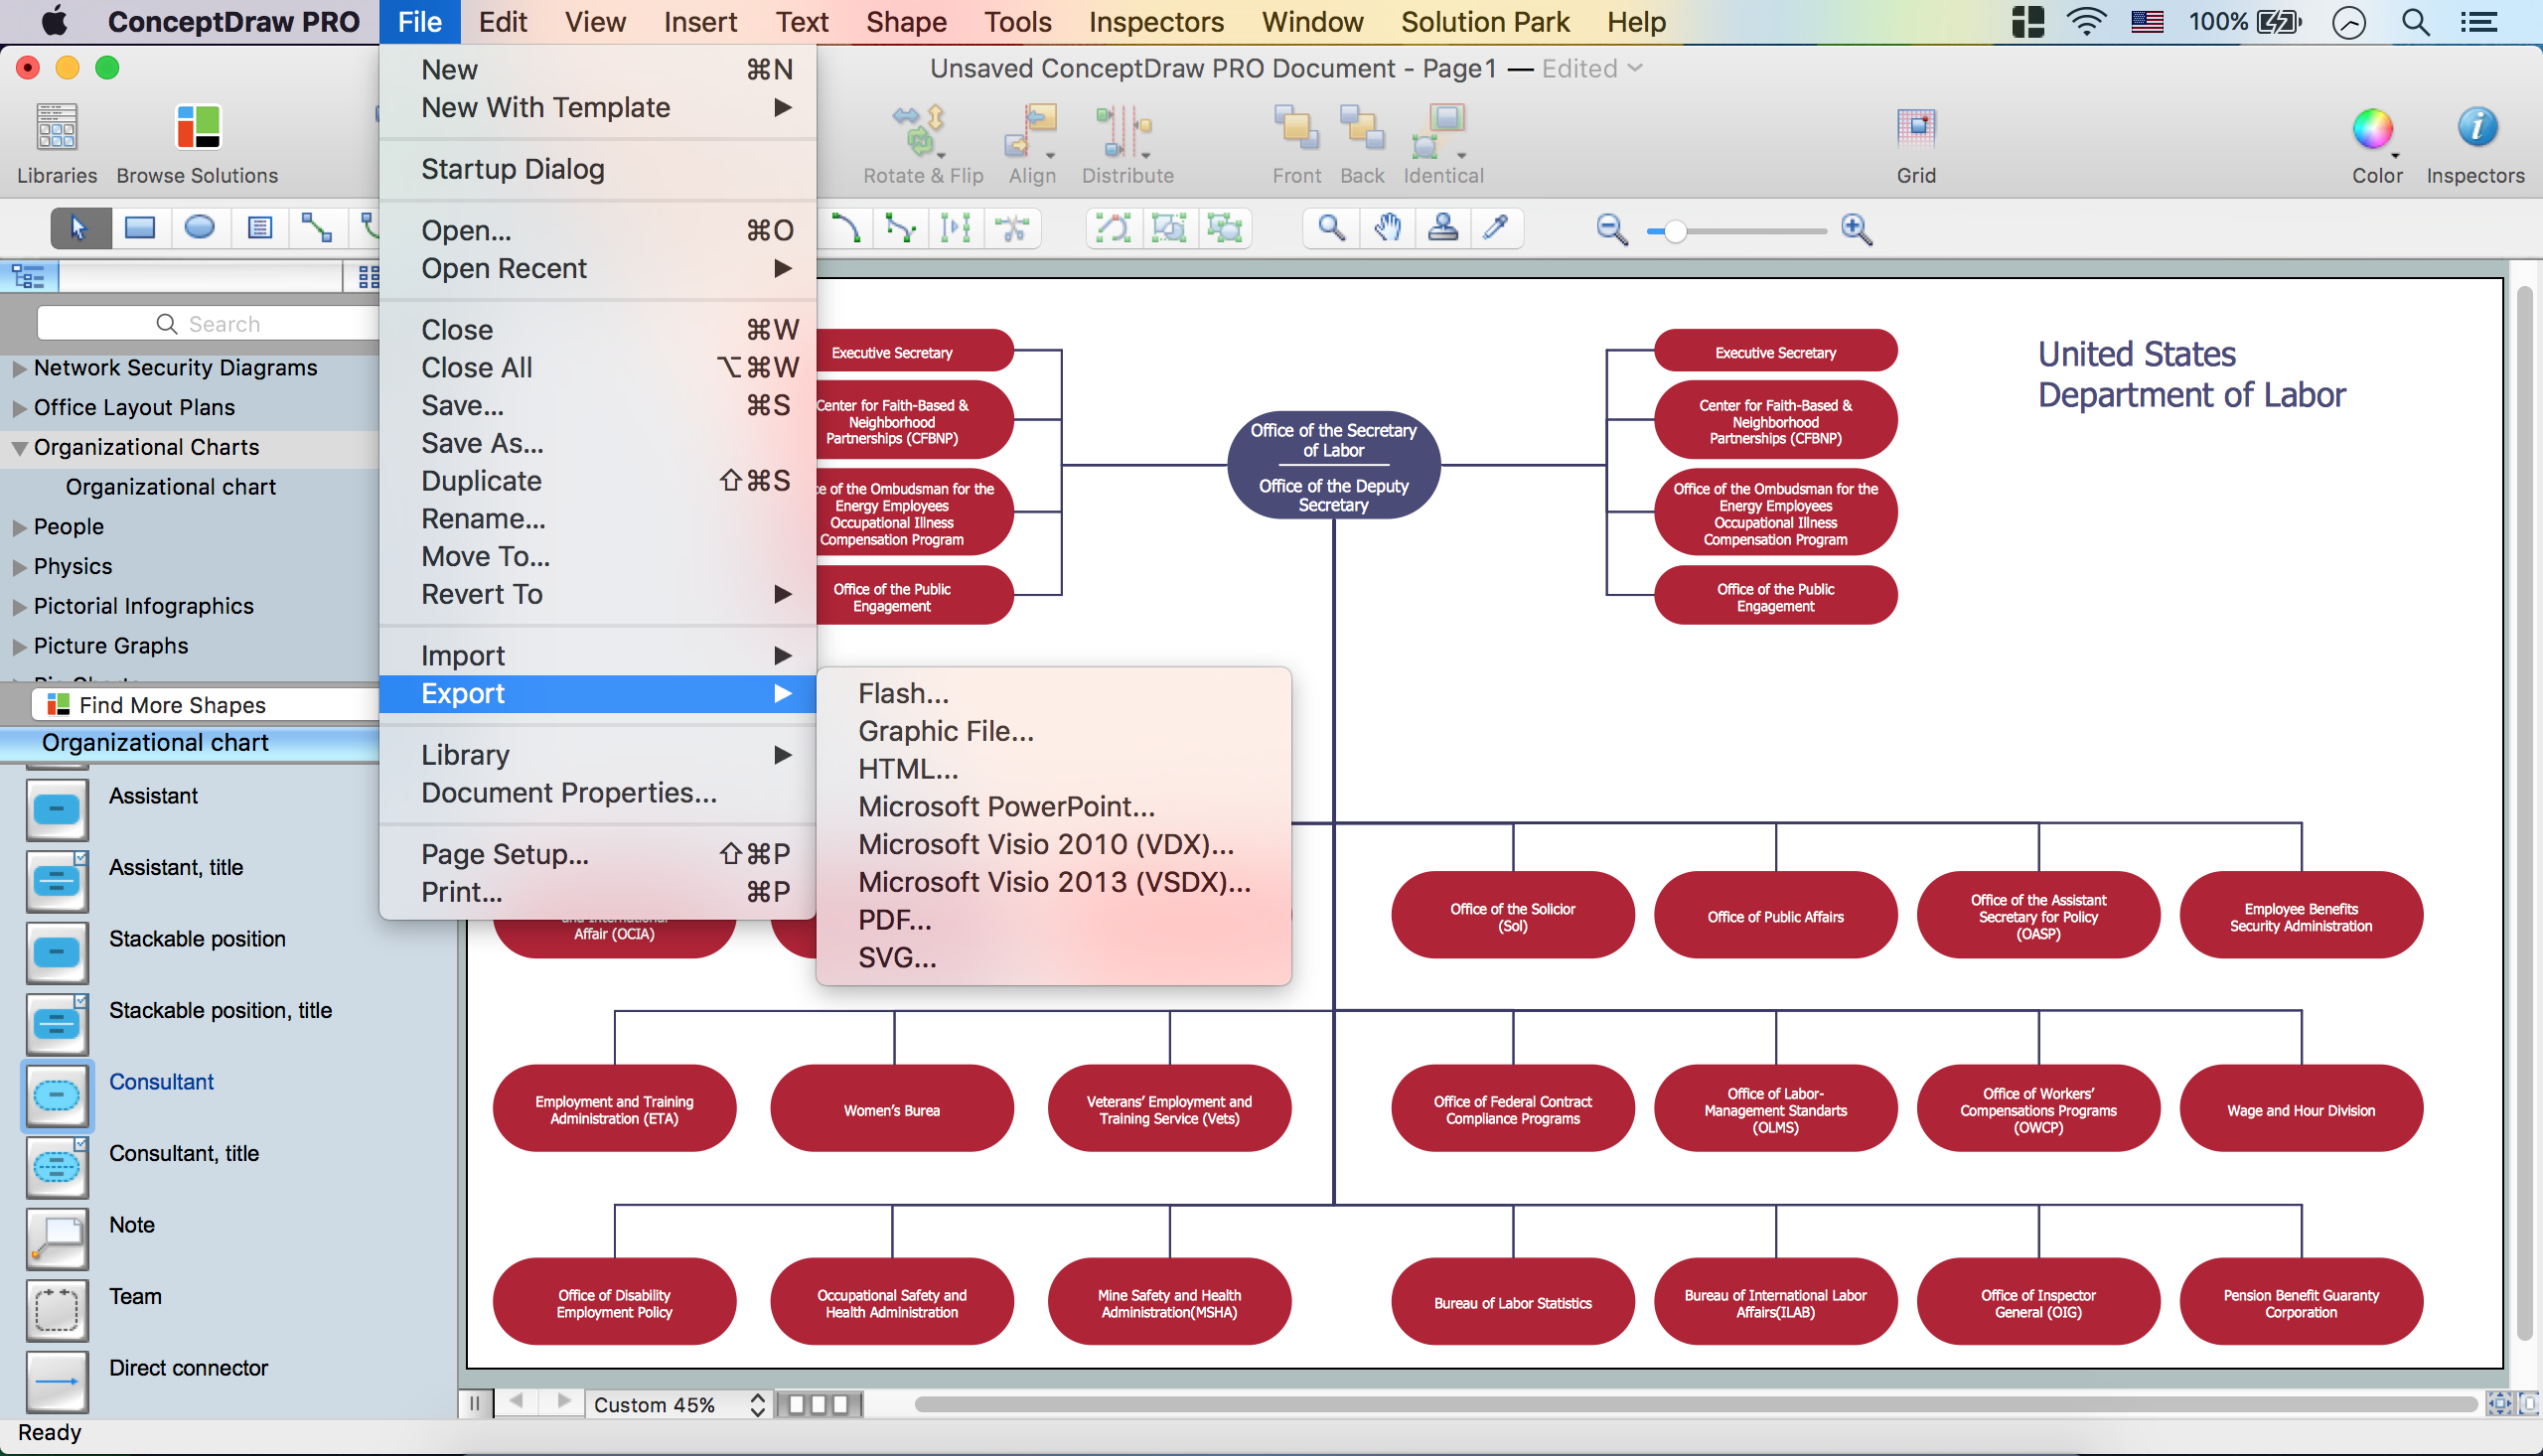
How to Draw an Organization Chart

Organizational Structure

ConceptDraw DIAGRAM - Organizational chart software

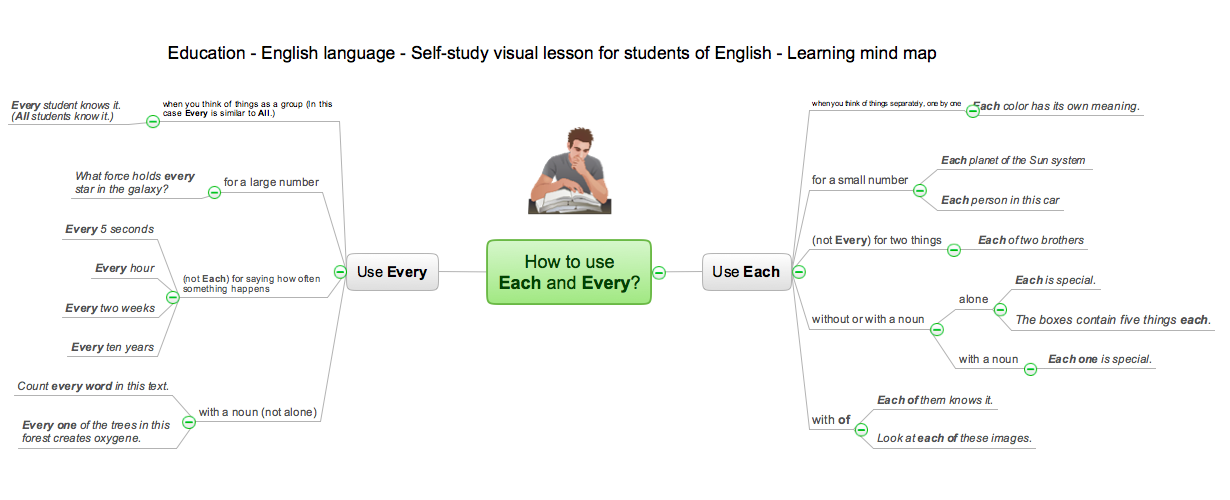
eLearning - Easy English on Skype

Modelling Complex Events with Event-Driven Process chain

Sales Process Management

It is effective to use professional software for the sales process management. ConceptDraw DIAGRAM diagramming and vector drawing software extended with Sales Flowcharts solution from the Marketing area of ConceptDraw Solution Park is the best choice.
Flowchart on Bank. Flowchart Examples


Marketing and Sales Organization chart. Organization chart Example

- Business Report Pie. Pie Chart Examples | Example of ...
- Floor Plans | Organizational Structure Of Mini Hotel
- 5 Hotel Organizational Chart Template
- How to Draw an Organization Chart | Marketing and Sales ...
- Compare Organizational Chart In Private And State Hotel
- Organizational Charts | What Constitutes a Project? | Hotel ...
- Network Diagram Examples | Draw And Explain Organizational ...
- Small Hotel Organizational Structure
- Create Organizational Chart | How To Create Emergency Plans and ...