ERD Symbols and Meanings


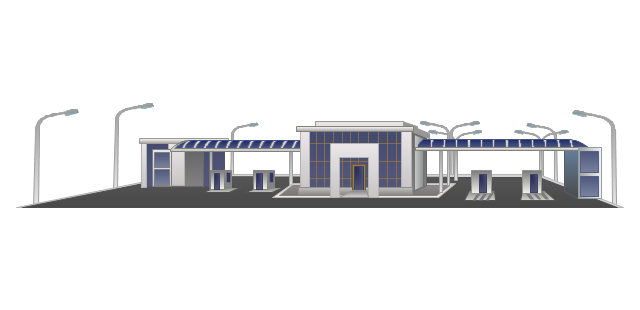
 Plant Layout Plans
Plant Layout Plans solution can be used for power plant design and plant layout design, for making the needed building plant plans and plant layouts looking professionally good. Having the newest plant layout software, the plant design solutions and in particular the ConceptDraw’s Plant Layout Plans solution, including the pre-made templates, examples of the plant layout plans, and the stencil libraries with the design elements, the architects, electricians, interior designers, builders, telecommunications managers, plant design engineers, and other technicians can use them to create the professionally looking drawings within only a few minutes.
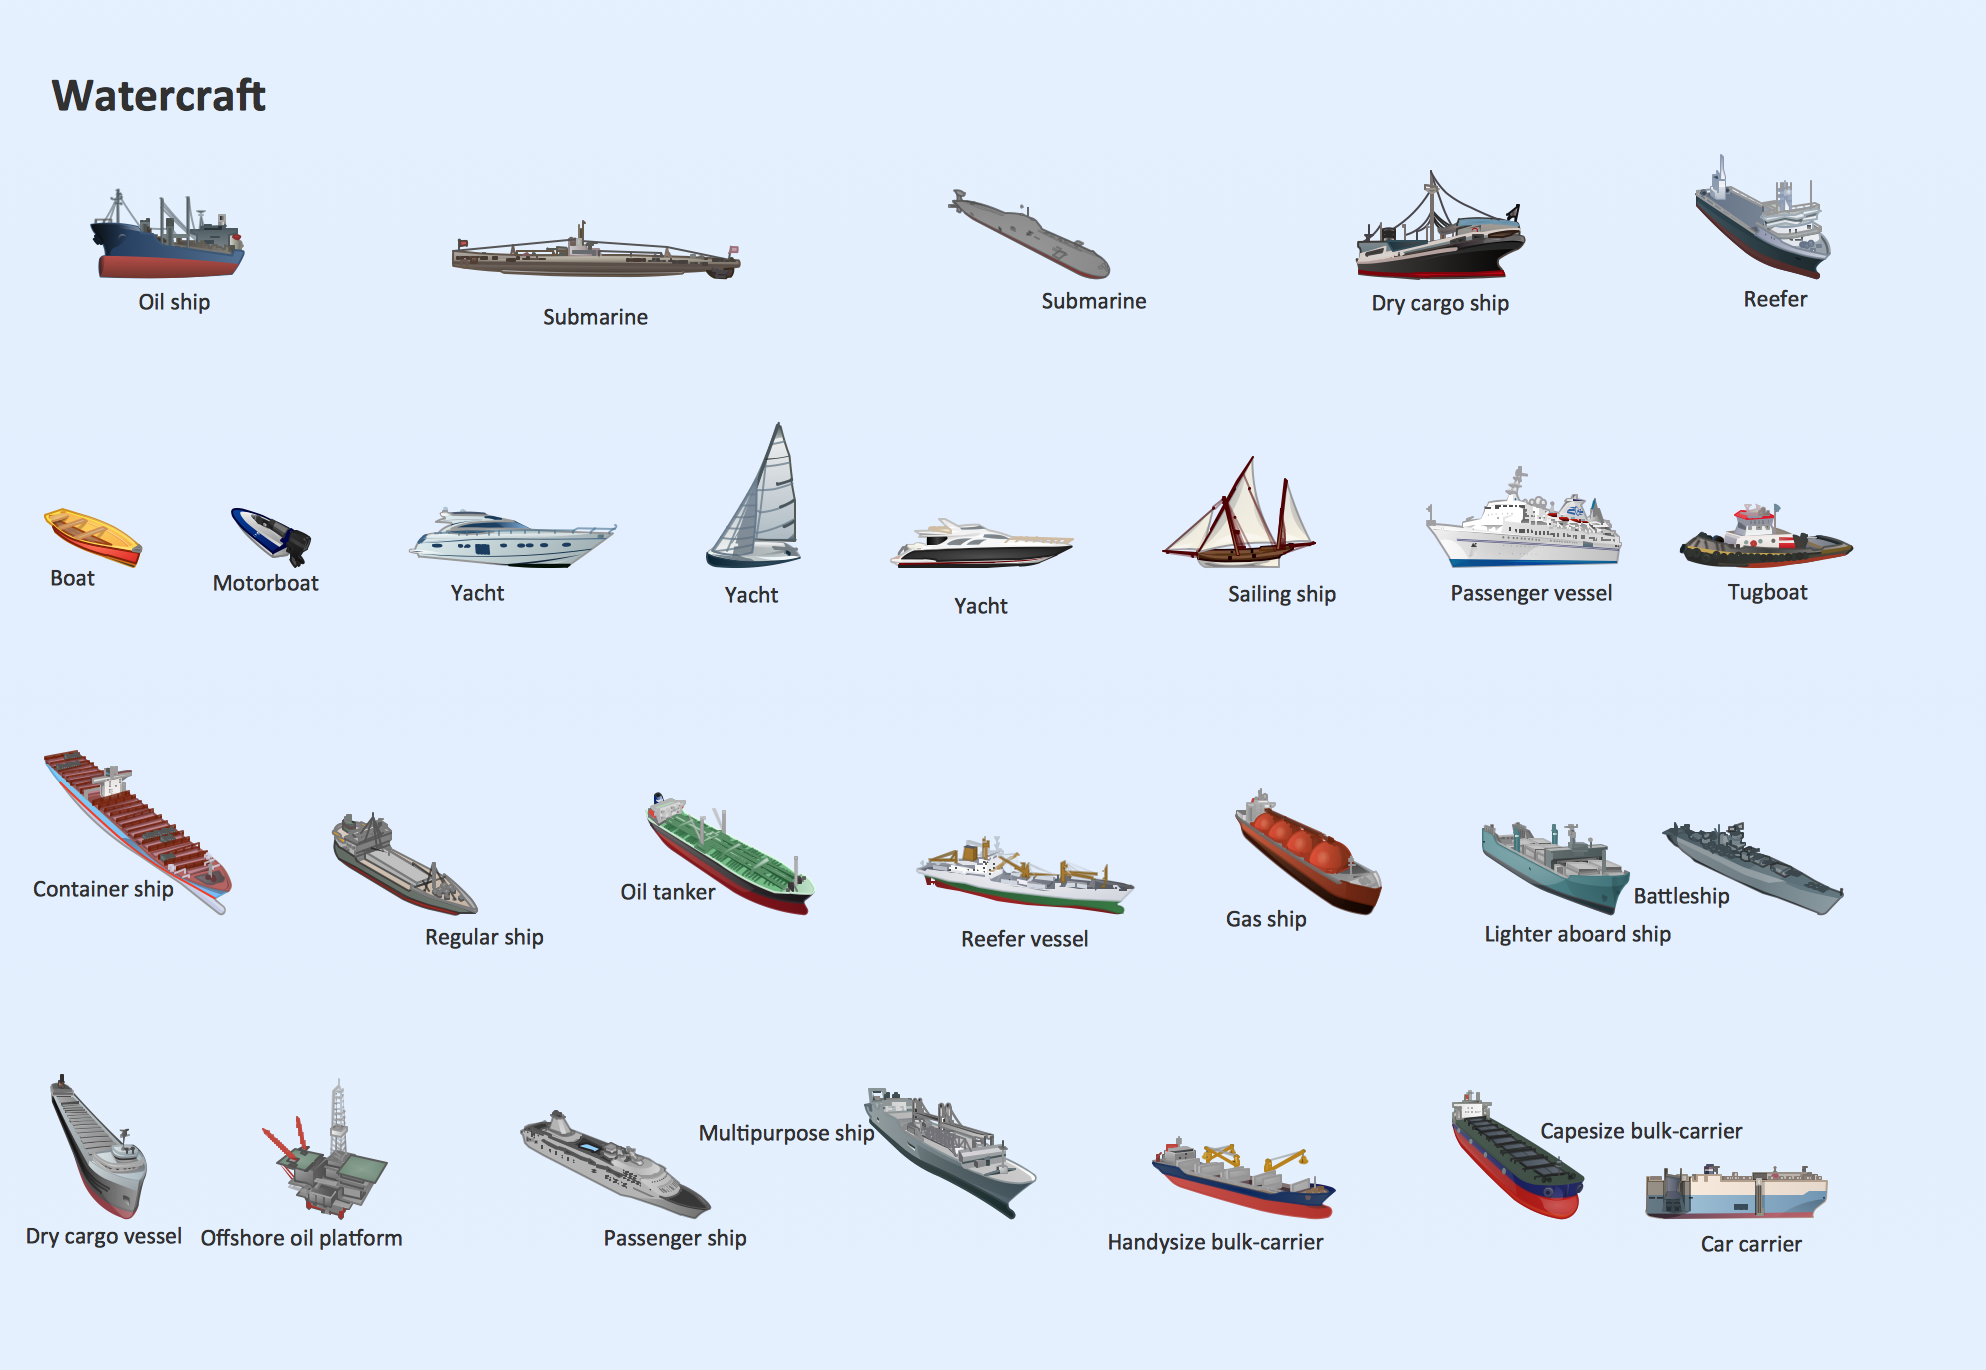
Watercraft - Design Elements
Best Value Stream Mapping mac Software

 Aerospace and Transport
This solution extends ConceptDraw DIAGRAM software with templates, samples and library of vector clipart for drawing the Aerospace and Transport Illustrations. It contains clipart of aerospace objects and transportation vehicles, office buildings and anci
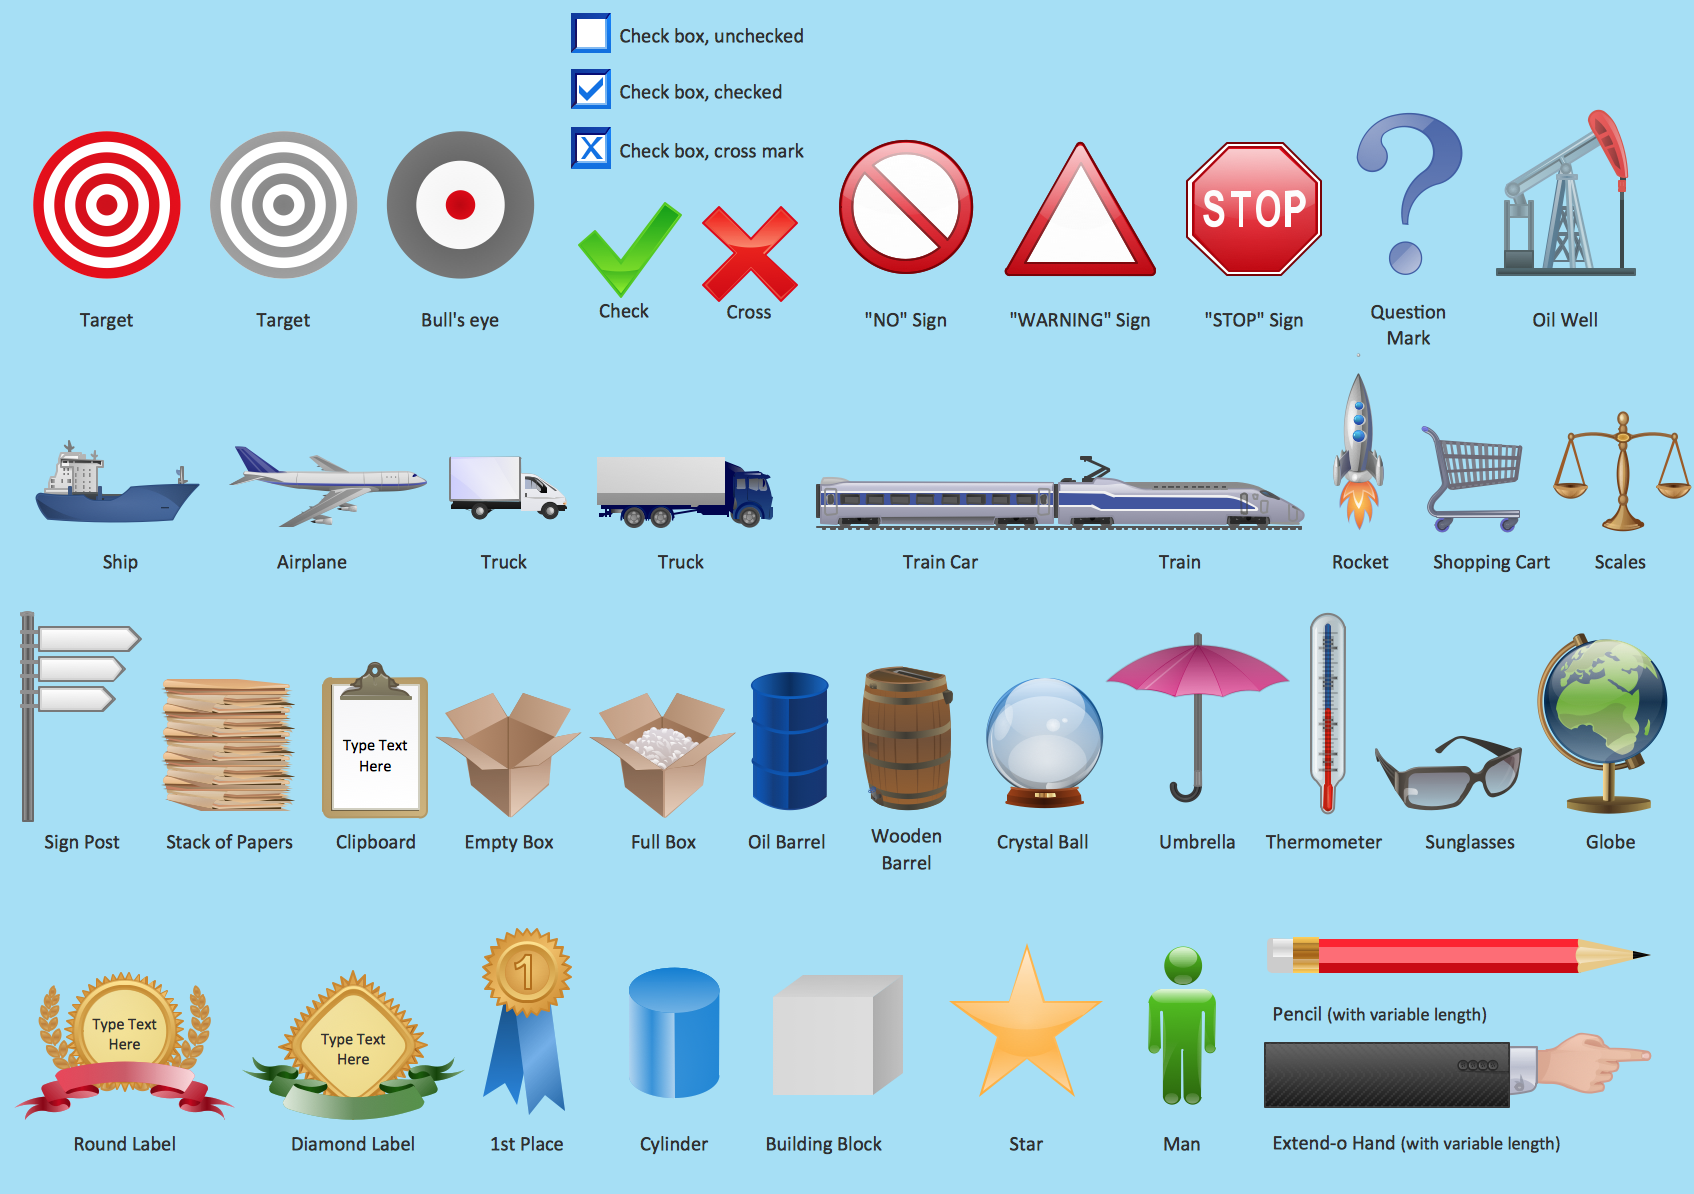
The vector stencils library "Packaging, loading, customs" contains 28 clipart images of packing materials and packaging equipment for drawing illustrations.
"Packaging is the technology of enclosing or protecting products for distribution, storage, sale, and use. Packaging also refers to the process of design, evaluation, and production of packages. Packaging can be described as a coordinated system of preparing goods for transport, warehousing, logistics, sale, and end use. Packaging contains, protects, preserves, transports, informs, and sells. In many countries it is fully integrated into government, business, institutional, industrial, and personal use." [Packaging and labeling. Wikipedia]
The clip art example "Packaging, loading, customs - Vector stencils library" was created in ConceptDraw PRO diagramming and vector drawing software using the Manufacturing and Maintenance solution from the Illustration area of ConceptDraw Solution Park.
Cardboard box
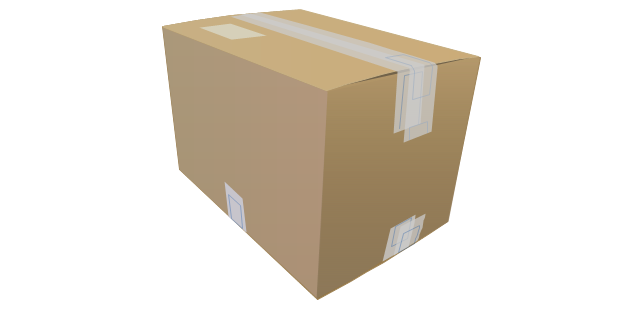
Cardboard box (open)
-packaging,-loading,-customs---vector-stencils-library.png--diagram-flowchart-example.png)
Paper bag

Woodgrain barrel
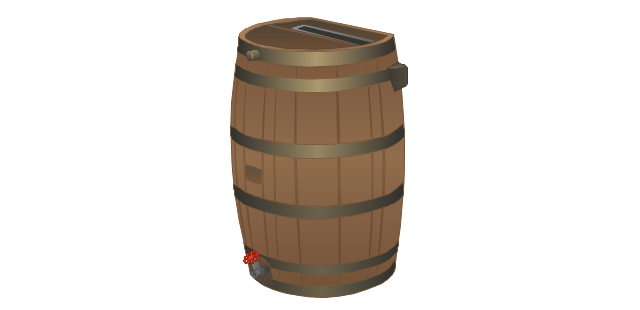
Barrel

Crate

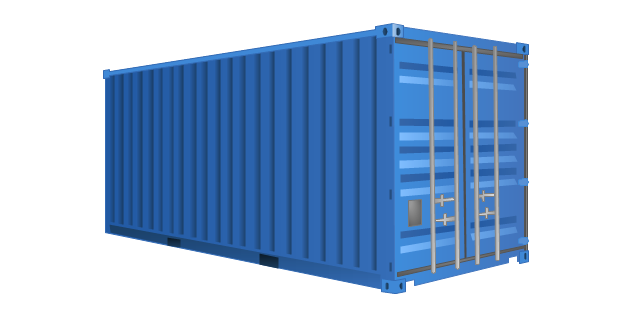
Container
Handcart with cardboard box
Flatbed trolley

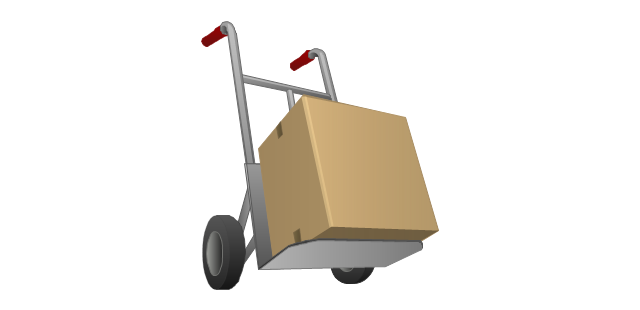
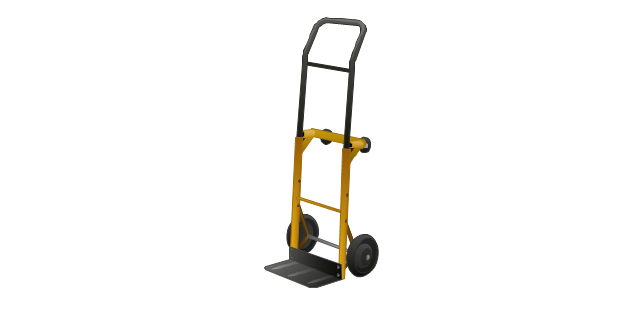
Hand truck
Porter

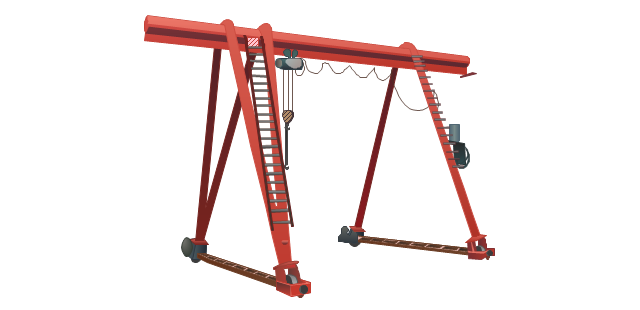
Gantry crane
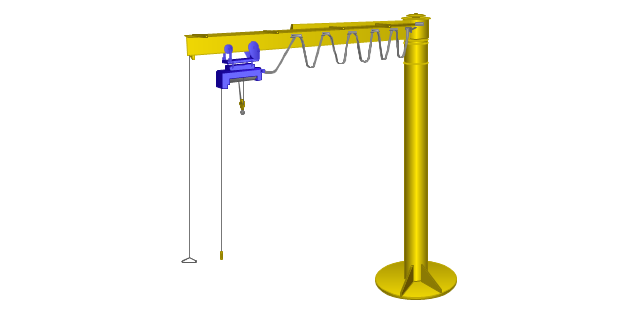
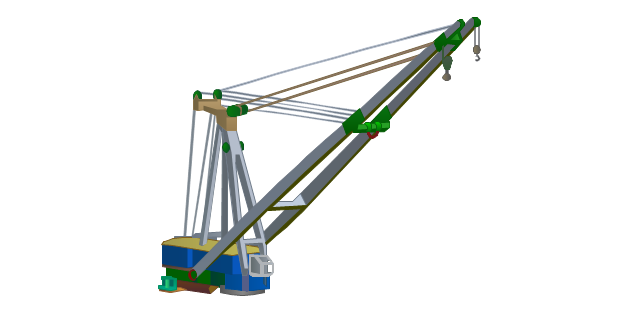
Jib crane
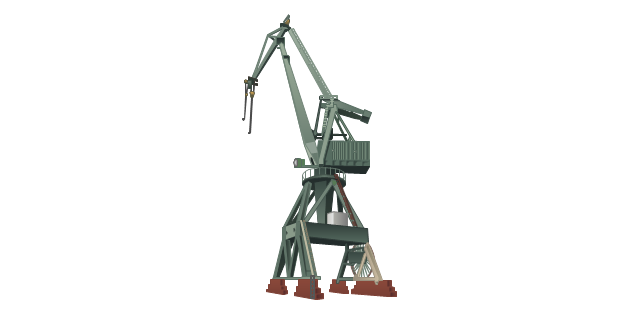
Level luffing crane
Deck crane
Packaging

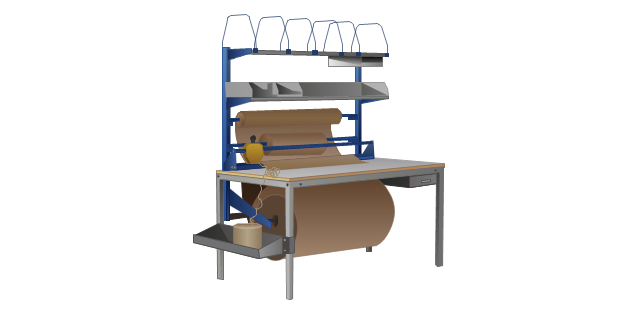
Packaging machine
Packing conveyor

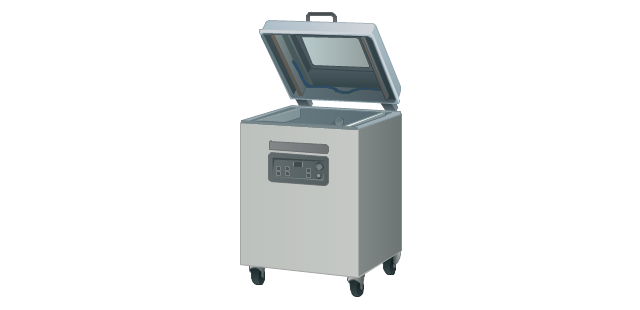
Vacuum packaging machine
State border sign

Border checkpoint
Customs sign

Border control

Port of entry office

Customs officer

Stocker with cardboard boxes

Warehouse workers

Pallet jack

 Entity-Relationship Diagram (ERD)
Entity-Relationship Diagram (ERD) solution extends ConceptDraw DIAGRAM software with templates, samples and libraries of vector stencils from drawing the ER-diagrams by Chen's and crow’s foot notations.
Marketing - Design Elements
This work flow chart sample was redesigned from the picture "Weather Forecast" from the article "Simulation Workflows".
[iaas.uni-stuttgart.de/ forschung/ projects/ simtech/ sim-workflows.php]
"(1) The weather is predicted for a particular geological area. Hence, the workflow is fed with a model of the geophysical environment of ground, air and water for a requested area.
(2) Over a specified period of time (e.g. 6 hours) several different variables are measured and observed. Ground stations, ships, airplanes, weather balloons, satellites and buoys measure the air pressure, air/ water temperature, wind velocity, air humidity, vertical temperature profiles, cloud velocity, rain fall, and more.
(3) This data needs to be collected from the different sources and stored for later access.
(4) The collected data is analyzed and transformed into a common format (e.g. Fahrenheit to Celsius scale). The normalized values are used to create the current state of the atmosphere.
(5) Then, a numerical weather forecast is made based on mathematical-physical models (e.g. GFS - Global Forecast System, UKMO - United Kingdom MOdel, GME - global model of Deutscher Wetterdienst). The environmental area needs to be discretized beforehand using grid cells. The physical parameters measured in Step 2 are exposed in 3D space as timely function. This leads to a system of partial differential equations reflecting the physical relations that is solved numerically.
(6) The results of the numerical models are complemented with a statistical interpretation (e.g. with MOS - Model-Output-Statistics). That means the forecast result of the numerical models is compared to statistical weather data. Known forecast failures are corrected.
(7) The numerical post-processing is done with DMO (Direct Model Output): the numerical results are interpolated for specific geological locations.
(8) Additionally, a statistical post-processing step removes failures of measuring devices (e.g. using KALMAN filters).
(9) The statistical interpretation and the numerical results are then observed and interpreted by meteorologists based on their subjective experiences.
(10) Finally, the weather forecast is visualized and presented to interested people." [iaas.uni-stuttgart.de/ forschung/ projects/ simtech/ sim-workflows.php]
The example "Workflow diagram - Weather forecast" was drawn using the ConceptDraw PRO diagramming and vector drawing software extended with the Workflow Diagrams solution from the Business Processes area of ConceptDraw Solution Park.
Work flow chart

- Shipping Process Flowchart
- Value Stream Mapping Shipping
- Process Flowchart | Value stream mapping - Vector stencils library ...
- Process Flowchart | Data Flow Diagram Model | Basic Flowchart ...
- Value Stream Mapping Production
- Process Mapping Of Shipment
- Order processing center - UML sequence diagram | Packaging ...
- Erd Shipment In Order Process System
- Dedicated Process
- Process Flowchart | Building Drawing Design Element: Shipping ...
- Shipping And Receiving Process Flowchart
- Manufacturing Processes Examples
- Basic Diagramming | Business - Workflow diagram | Process Flow ...
- Value stream with ConceptDraw PRO | Value stream mapping ...
- Shipping Truck Vector
- Production Kanban
- Packaging, loading, customs - Vector stencils library | Design ...
- Building Drawing Software for Design Shipping and Receiving ...
- Business Process Mapping — How to Map a Work Process ...
- Production Control