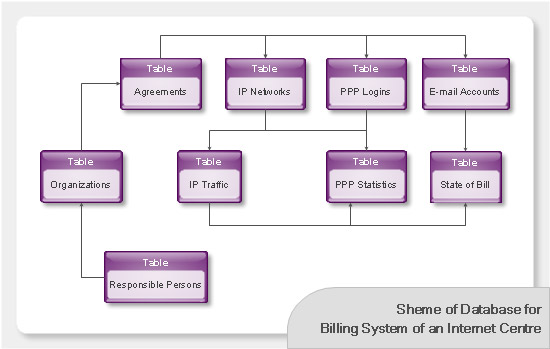
Databases Access Objects Model with ConceptDraw DIAGRAM
Interior Design. Office Layout Plan Design Element


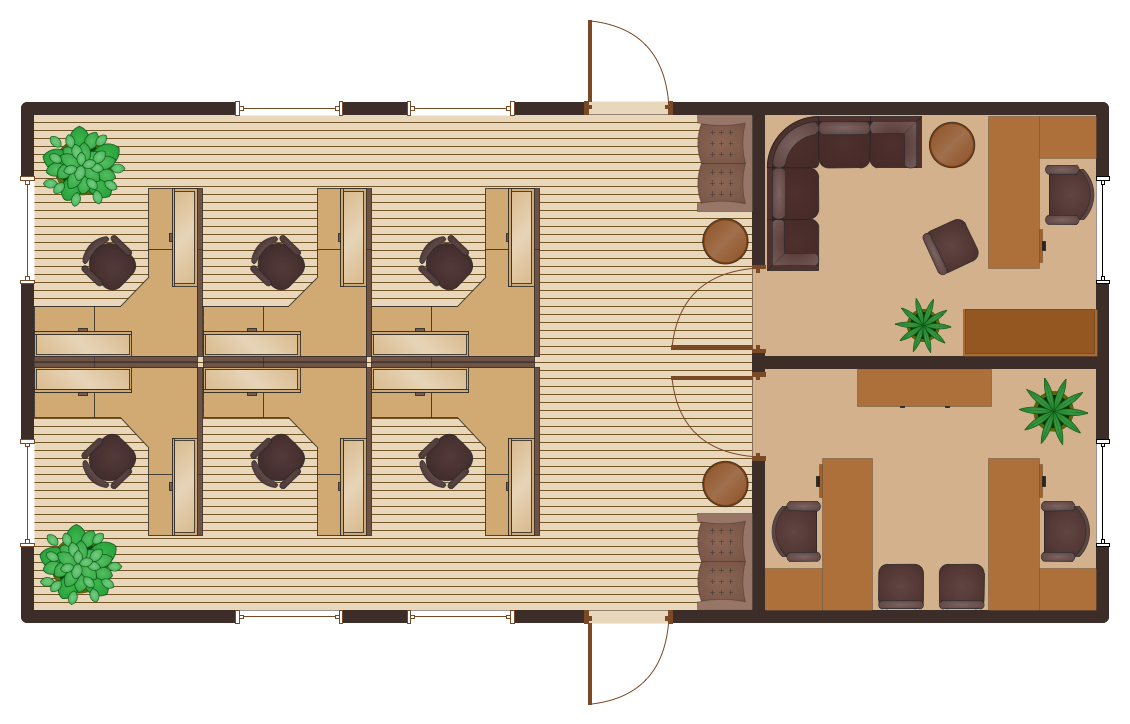
This office interior design sample illustrates cubicle layout of furniture on the floor plan.
"Тhe cubicle, cubicle desk, office cubicle or cubicle workstation is a partially enclosed workspace, separated from neighboring workspaces by partitions that are usually 5–6 feet (1.5–1.8 m) tall. Its purpose is to isolate office workers from the sights and noises of an open workspace so that they may concentrate without distractions. Cubicles are composed of modular elements such as work surfaces, overhead bins, drawers, and shelving, which can be configured depending on the user's needs. Installation is generally performed by professionals, although some cubicles allow configuration changes to be performed by users without specific training." [Cubicle. Wikipedia]
The office interior design example "Cubicle layout" was created using the ConceptDraw DIAGRAM diagramming and vector drawing software extended with the Office Layout Plans solution from the Building Plans area of ConceptDraw Solution Park.
Office floor plan

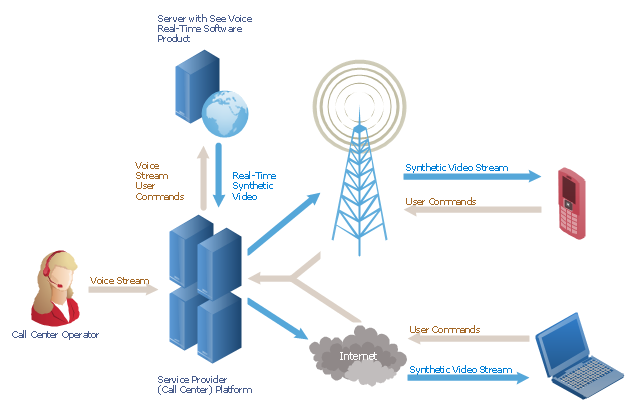
"A call centre or call center is a centralised office used for the purpose of receiving or transmitting a large volume of requests by telephone. An inbound call centre is operated by a company to administer incoming product support or information inquiries from consumers. Outbound call centers are operated for telemarketing, solicitation of charitable or political donations, debt collection and market research. In addition to a call centre, collective handling of letter, fax, live support software,social media and e-mail at one location is known as a contact centre.
A call centre is operated through an extensive open workspace for call centre agents, with work stations that include a computer for each agent, a telephone set or headset connected to a telecom switch, and one or more supervisor stations. It can be independently operated or networked with additional centres, often linked to a corporate computer network, including mainframes, microcomputers and LANs. Increasingly, the voice and data pathways into the centre are linked through a set of new technologies called computer telephony integration (CTI)." [Call centre. Wikipedia]
This call center network diagram example was created using the ConceptDraw PRO diagramming and vector drawing software extended with the Telecommunication Network Diagrams solution from the Computer and Networks area of ConceptDraw Solution Park.
Network scheme
HelpDesk
How to Create the Custom Diagram Template
Scrum process work items and workflow

HelpDesk
How to Draw an Organizational Chart

HelpDesk
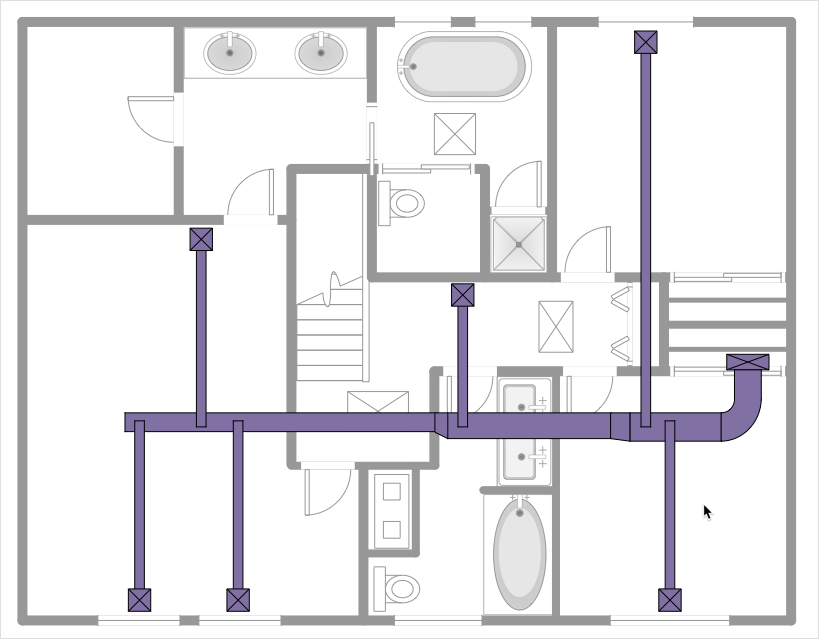
How to Create a HVAC Plan
HelpDesk
How to Create a Mechanical Diagram
Product Overview

HelpDesk
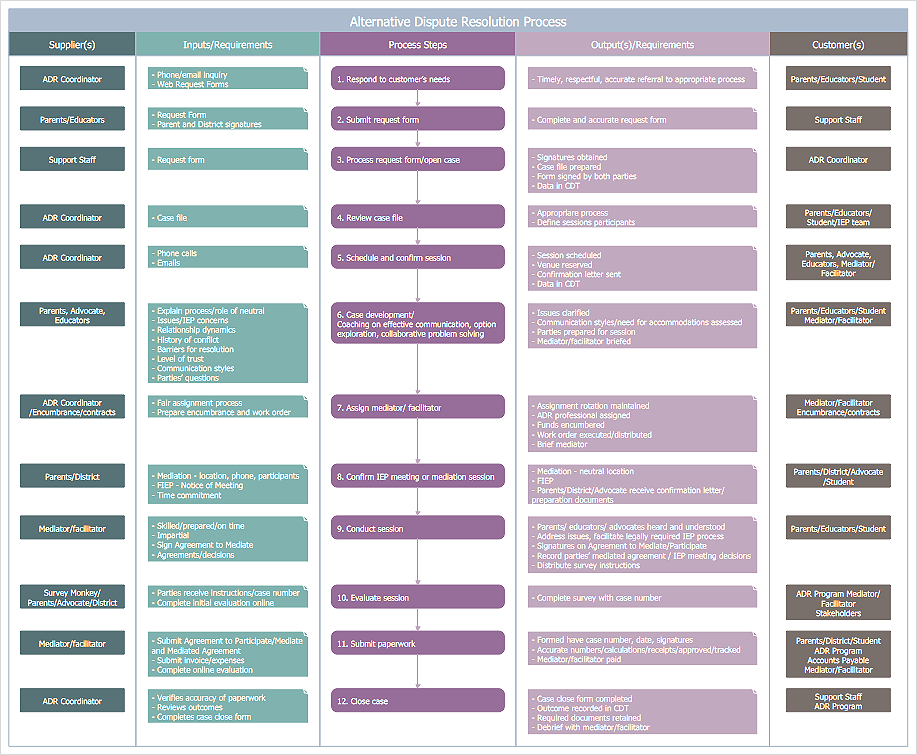
How to Create a SIPOC Diagram
Office Ideas
HelpDesk
How to Create a Network Security Diagram

HelpDesk
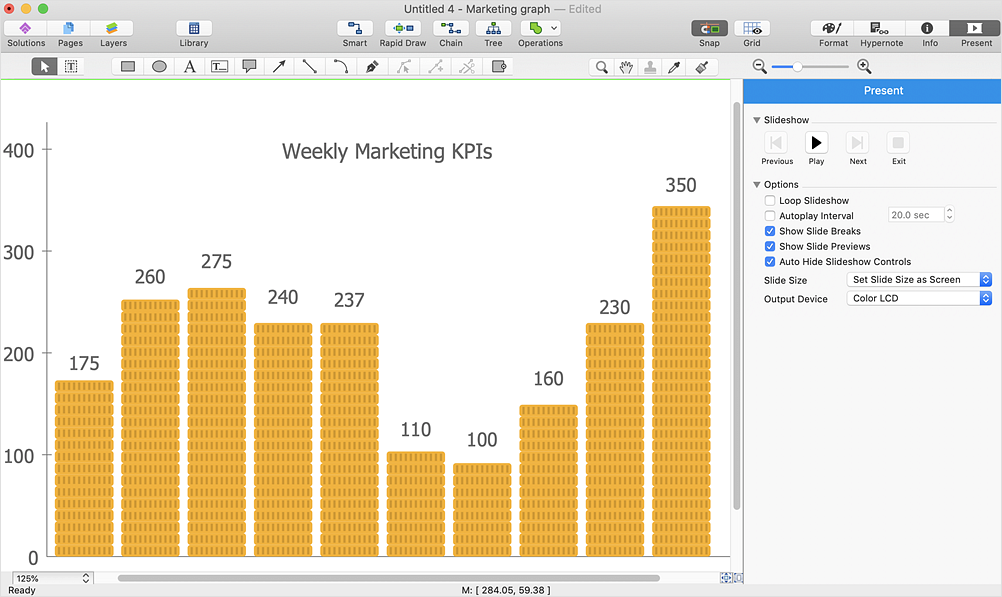
How to Draw a Pareto Chart

- Office Layout Plans | Office Layout | Interior Design Office Layout ...
- Open Office Workspace Design
- Office Layout Plans | Office plan - Cubicle layout | Design elements ...
- Open Office Layout
- Open Plan Cubicles
- Office plan - Cubicle layout | Cubicles and work surfaces - Vector ...
- Office Layout Plans | Building Drawing Software for Design Office ...
- Interior Design Office Layout Plan Design Element | Building ...
- Building Drawing Software for Design Office Layout Plan | Office ...
- Office plan - Cubicle layout | Cubicles and work surfaces - Vector ...
- Office plan - Cubicle layout | How To Draw Building Plans | Design ...
- Office Layout Plans | Building Drawing Software for Design Office ...
- Interior Design Office Layout Plan Design Element | Office plan ...
- Cubicles and work surfaces - Vector stencils library | Cubicles and ...
- Office Layout Plans | Office Layout | Building Drawing Software for ...
- Office plan - Cubicle layout | Interior Design Office Layout Plan ...
- How to Open MS Visio® 2013/2016 Files on a Mac® Using ...
- Office Layout Plans | Building Drawing Software for Design Office ...
- Office plan - Cubicle layout | Network Topologies | Floor Plan Of ...
- Office Work Plan