This onion diagram sample was created on the base of the figure "Social Ecological Model (SEM)" illustrating the webpage "Cultural Competence" from the US Centers for Disease Control and Prevention (CDC) website.
"Why consider cultural competence?
It is important to communicate effectively to both the disparately affected population(s) of interest as well as other key stakeholders at the community, state, and national levels.
The diagram of the Social Ecological Model (SEM) ... depicts how health behaviors of an individual (inner oval) are influenced by the interpersonal, organizational, community, and public policy contexts and environment in which that person exists. Cultural context resides in the interpersonal band, making it a critical consideration when designing any communication plan. All obesity prevention communications should take the culture (e.g., language, thoughts, communications, actions, customs, beliefs, values, and institutions of racial, ethnic, religious, or social groups) of the target population into consideration to be effective. Interventions that successfully achieve this goal demonstrate cultural competence - behaviors, attitudes, and policies that come together in a system, agency, or among professionals to enable people to work effectively in a cross-cultural situation."
[cdc.gov/ obesity/ health_ equity/ culturalRelevance.html]
The onion diagram example "Social Ecological Model (SEM)" was created using the ConceptDraw PRO diagramming and vector drawing software extended with the Target and Circular Diagrams solution from the Marketing area of ConceptDraw Solution Park.
www.conceptdraw.com/ solution-park/ marketing-target-and-circular-diagrams
Onion diagram
---onion-diagram.png--diagram-flowchart-example.png)
Stakeholder Onion Diagrams

 Stakeholder Onion Diagrams
The Stakeholder Onion Diagram is often used as a way to view the relationships of stakeholders to a project goal. A basic Onion Diagram contains a rich information. It shows significance of stakeholders that will have has influence to the success achieve
Onion Diagram Templates

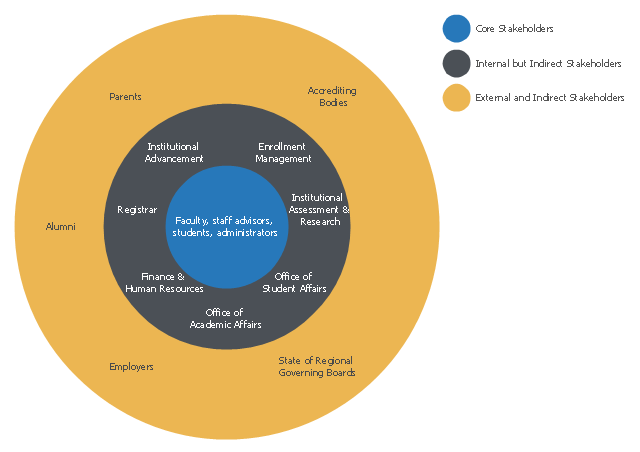
This onion diagram example was designed on the base of figure "Academic advising stakeholder framework" in the article "Defining Advising Stakeholder Groups" by Julianne Messia from the website of NACADA Executive Office,
Kansas State University.
"A complete stakeholder analysis, therefore, not only names the stakeholders but accurately characterizes each stakeholder’s power and influence.
Harney (2008) identified advising stakeholders as being either internal or external constituents. Stakeholders belong in one of three distinct classifications: (1) internal core stakeholders, (2) internal but indirect stakeholders, and (3) external and indirect stakeholders. The chart below (Figure 1) depicts these groups in a diagram representing their various levels of input, influence, and involvement; the closer a group is to the “core” the more investment and weight that group has in advising. The groups utilized in this specific example assume a shared model of advising (both faculty and advising professionals have advising responsibilities). As each institution has its own unique culture and advising model, the chart should be adapted for any program or institution. For instance, an institution with a centralized advising model may list faculty as Internal but Indirect Stakeholders as they do not provide or administer advising directly."
[nacada.ksu.edu/ Resources/ Clearinghouse/ View-Articles/ Defining-Advising-Stakeholder-Groups.aspx]
The onion diagram example "Stakeholder diagram" was drawn using the ConceptDraw PRO software extended with the Stakeholder Onion Diagrams solution from the Management area of ConceptDraw Solution Park.
Onion diagram example
Stakeholder Onion Diagram Template

Onion Diagram Maker

Stakeholder Mapping Tool

Visualize Stakeholder Analysis

Pyramid Diagram

- Stakeholder Onion Diagram Template | How To Create Onion ...
- Organizational culture - Triangle diagram | How to Create an Audit ...
- Social Ecological Model (SEM) - Onion diagram | Sales Call | Hiring ...
- Social Ecological Model (SEM) - Onion diagram | Social ...
- Social Ecological Model (SEM) - Onion diagram | Path to ...
- Social Ecological Model (SEM) - Onion diagram | Forces shaping ...
- Social Ecological Model (SEM) - Onion diagram | SWOT Analysis ...
- Organizational culture - Triangle diagram | With The Aid Of Diagram ...
- Social Ecological Model (SEM) - Onion diagram | Circle-Spoke ...