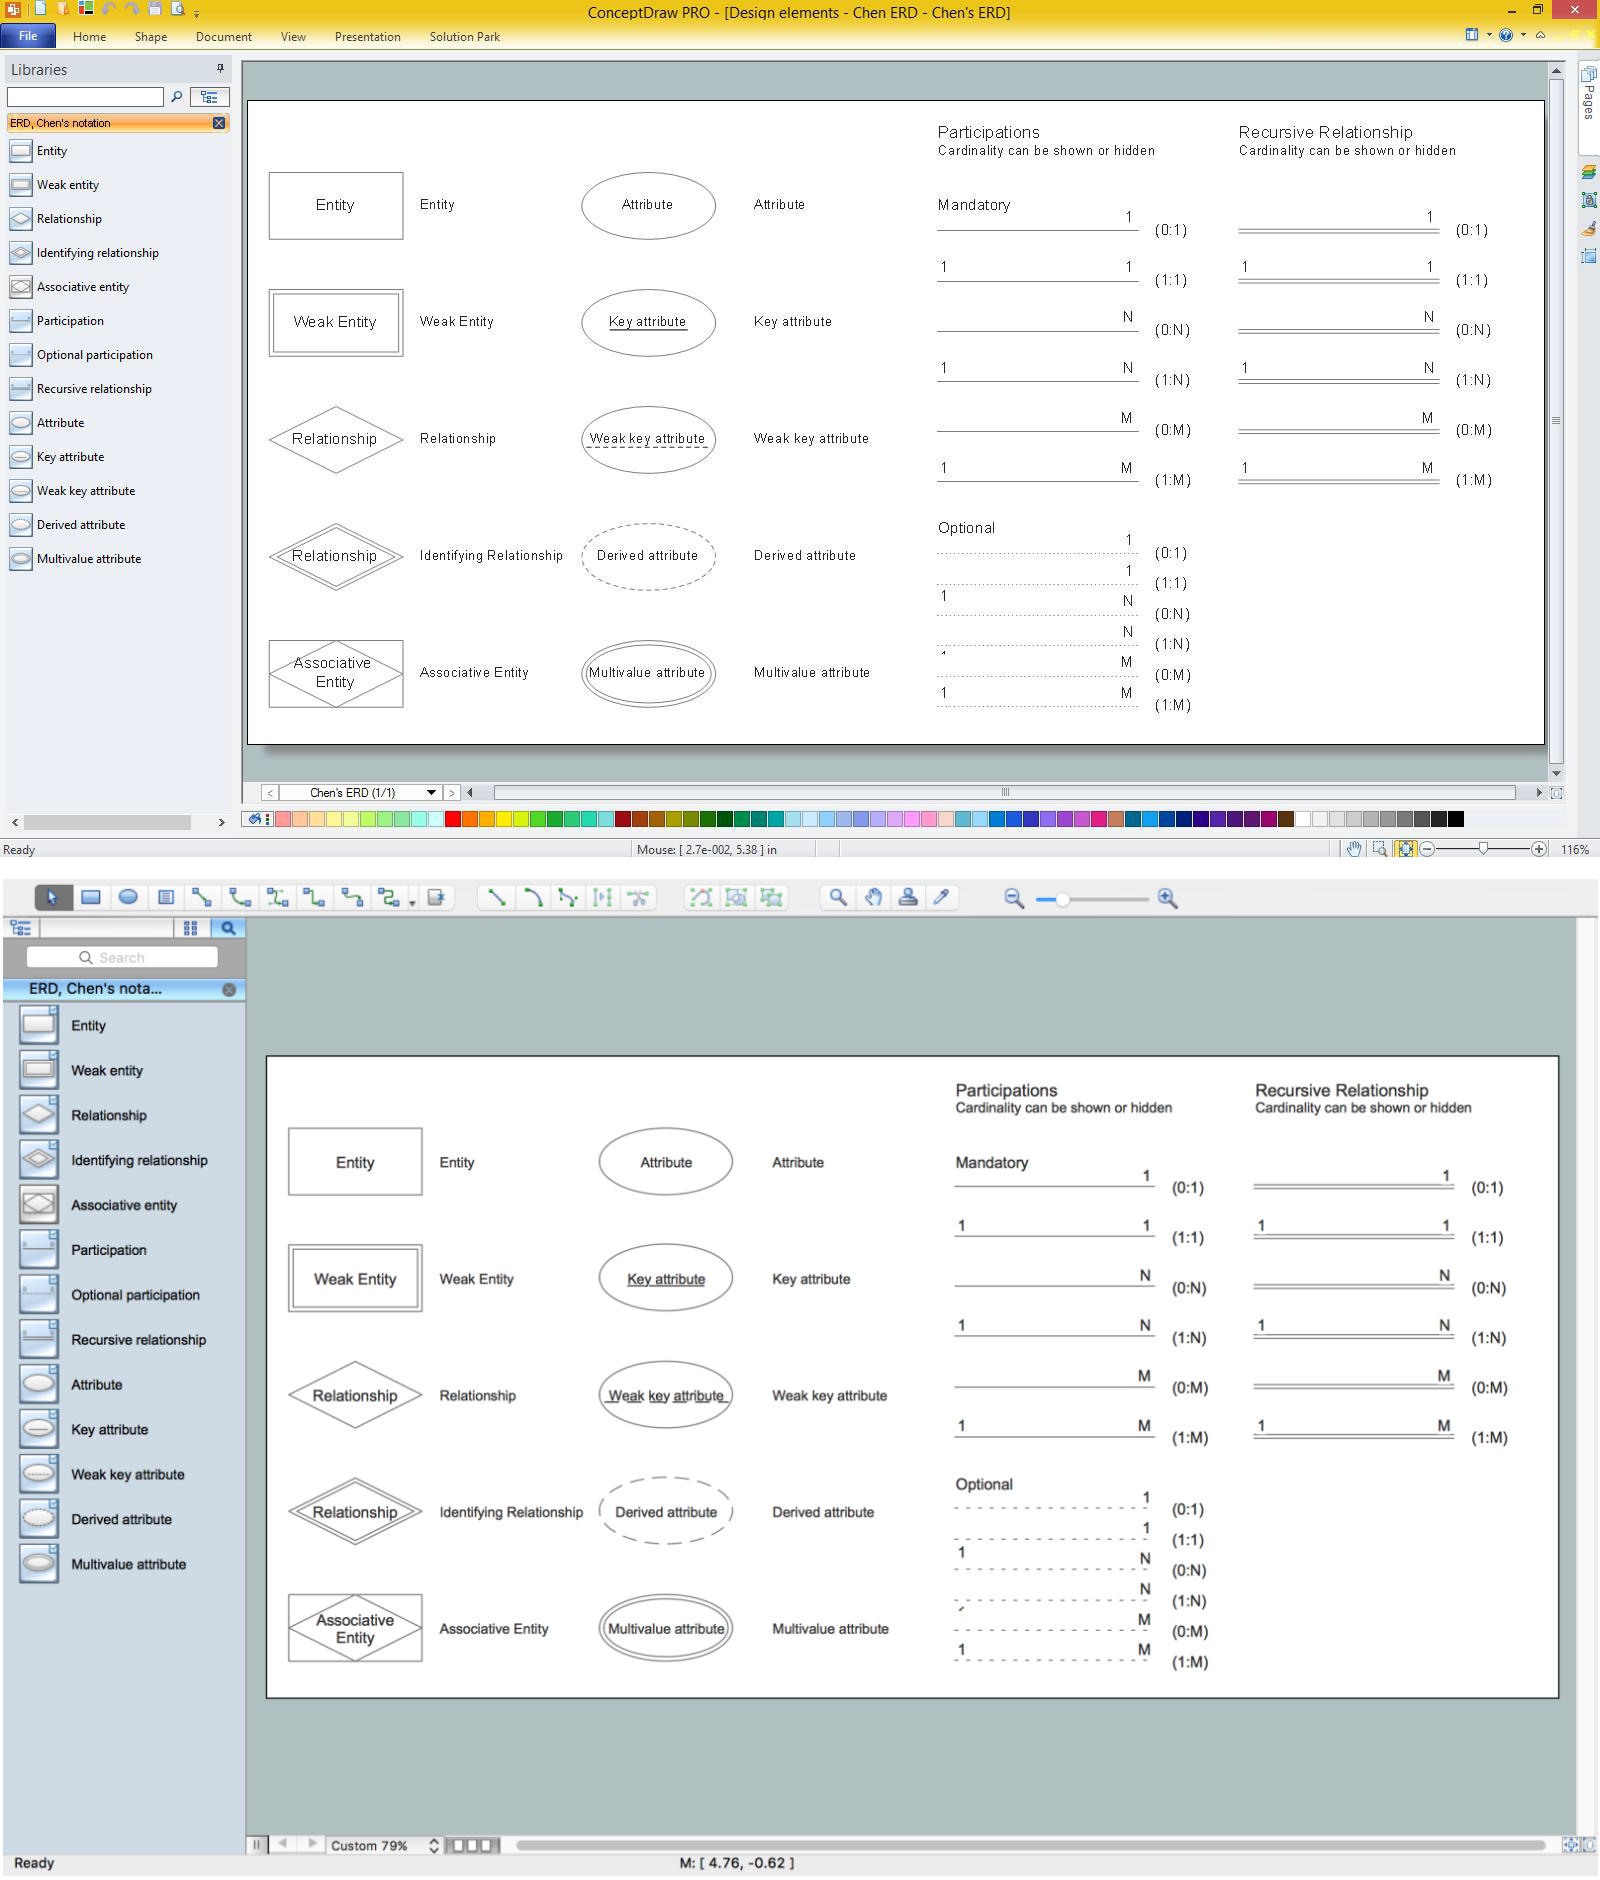
This site uses cookies. By continuing to browse the ConceptDraw site you are agreeing to our Use of Site Cookies.

Entity Relationship Diagram Symbols

Creating an entity-relationship (ER) model is to visually represent the structure of a business database, where data equates to entities (or objects) that are linked by defined relationships expressing dependencies and requirements. By nature it is an abstract visualization, the first step in the design process towards creating a logical and functional database.
ERD symbols used for professional ERD drawing are collected in libraries from the Entity-Relationship Diagram (ERD) solution for ConceptDraw DIAGRAM.

ERD Symbols and Meanings

Crow's foot notation is used in Barker's Notation, Structured Systems Analysis and Design Method (SSADM) and information engineering. Crow's foot diagrams represent entities as boxes, and relationships as lines between the boxes. Different shapes at the ends of these lines represent the cardinality of the relationship.
The Chen's ERD notation is still used and is considered to present a more detailed way of representing entities and relationships.
To create an ERD, software engineers mainly turn to dedicated drawing software, which contain the full notation resources for their specific database design - ERD symbols and meanings. CS Odessa has released an all-inclusive Entity-Relationship Diagram (ERD) solution for their powerful drawing program, ConceptDraw DIAGRAM.
How to Build an Entity Relationship Diagram (ERD)

ER Diagram Styles

When creating ER diagrams, you can apply different color ER diagram styles and also notation styles. ConceptDraw DIAGRAM enhanced with Entity-Relationship Diagram (ERD) Solution gives the ability to draw visual and attractive ER Diagrams using the style icons from Crow’s Foot notation and Chen's notation professionally designed and offered by ERD Chen's Notation and ERD Crow’s Foot Notation libraries.

UML Class Diagram. Design Elements

UML Class Diagrams describes the structure of a system by showing the system's classes, their attributes, and the relationships among the classes.

What is Entity-Relationship Diagram

Entity Relationship Diagram (ERD) is an acknowledged method to visualize the logical structure of databases. Using special symbols described in ERD notations you can depict a database of any complexity.
The vector graphic ER diagrams produced when using ConceptDraw ERD solution can be used in whitepapers, presentations, datasheets, posters, or any technical materials.

Standard Shapes for Value Stream Mapping

ConceptDraw Value Stream Mapping solution extends software with templates, samples and vector shapes for drawing Value Stream Maps (VSM).

Graphical Symbols to use in EPC diagrams

Event-Driven Process Chain Diagrams for improvement throughout an organisation.
ConceptDraw DIAGRAM - software that reduces the time needed to create a business process model.

Entity Relationship Diagram - ERD - Software for Design Crows Foot ER Diagrams

Crow's Foot notation was proposed by Gordon Everest. According to this notation, the entity is represented by rectangle, relation is depicted by line which ties two entities involved in a relationship. Entity-relationship diagrams based on both Chen's and Crow's Foot notations, can be easily drawn using the ConceptDraw DIAGRAM ERD diagrams software tools for design element Crow's Foot and Chen from Entity-Relationship Diagram (ERD) solution.
How to Build an Entity Relationship Diagram (ERD)

Design Element: Chen for Entity Relationship Diagram - ERD

Entity-relationship diagrams (ERDs) are intended for the development of data models and provide a standard method for determining data and relationships between them. The first notation for ERD was introduced by Chen. Entity-Relationship Diagram (ERD) solution from Software Development area of ConceptDraw Solution Park provides the libraries with predesigned set of ERD diagram design element Chen corresponding entities and relationships.

E-R Diagrams

Complexity of databases increases day by day, due to this the Entity relationship models and E-R diagrams become more and more popular, and now are an important part of database design. E-R diagrams created at ConceptDraw DIAGRAM allow visually and graphically represent structure and design of databases.