This site uses cookies. By continuing to browse the ConceptDraw site you are agreeing to our Use of Site Cookies.
HelpDesk

How to Operate with Project Time Frames in ConceptDraw PROJECT

ConceptDraw PROJECT applies an advanced scheduling facilities to enable you arrange your project's tasks with existing human and material resources. Comprehension of project scheduling principle allows you to plan the project the best way to execute it. Sometimes user is wondering why the task is moved to a different time than he supposed. Or he may be confused when a task's tardiness provoke the unwanted shift of other tasks. This article describes how do changes to the Start/Finish dates, or the Duration of the task affect the project schedule, created in ConceptDraw PROJECT.
HelpDesk

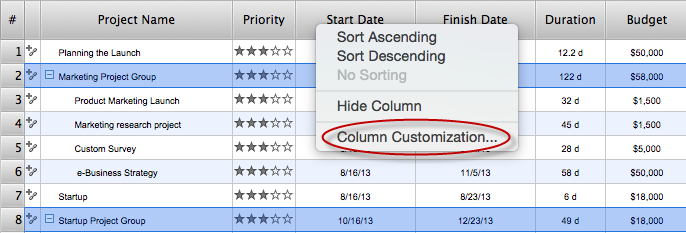
What Information to be Displayed in the ConceptDraw PROJECT Gantt Chart View

What information can contain the project task list? Gantt Chart view is a graphical representation of a project outline that allows one to allocate tasks. You can customize a project’s tasks list view to include the columns you need to meet your information requirements. The columns of the ConceptDraw PROJECT Gantt view contain the information you want to capture about each task in your project. The following article details what information can be contained in the columns of a project outline:<
HelpDesk

How to Set a Project Baseline

Project baseline in ConceptDraw PROJECT is excellent for guiding the execution of the current project and can be useful for further projects.
HelpDesk

How to Import Project Data From MS Excel File

You can import information into the project from MS Excel workbook using the entered fields - fields in which you can enter or edit information as opposed to calculated fields.
HelpDesk

How to Show the Relationship Between Topics

Any mind map contains topics that are arranged in a radial structure. It depicts the relation (semantic, causal, association, etc.) between the concepts, parts, and components of the main idea. In addition to the main connections that make the structure of a mind map, topics can be linked with other lines. ConceptDraw MINDMAP allows you to show the relationships between topics, which belong to different parts of the mind map structure, but also influence each other. Relationships help to show and organize complex interconnections between topics of mind map visually. Such communication is also very important - the mind map, where many topics are not related, tends to turn into a common text!
HelpDesk

How to Track Your Project Plan vs. the Actual Project Condition

ConceptDraw PROJECT provides a user with the possibility to track how the project is going. Project Manager can compare the actual data with the planned and assess possible measures to resolve issues. ConceptDraw PROJECT has several types of visual reports that can help to assess visually the difference between planned and actual project data.
HelpDesk

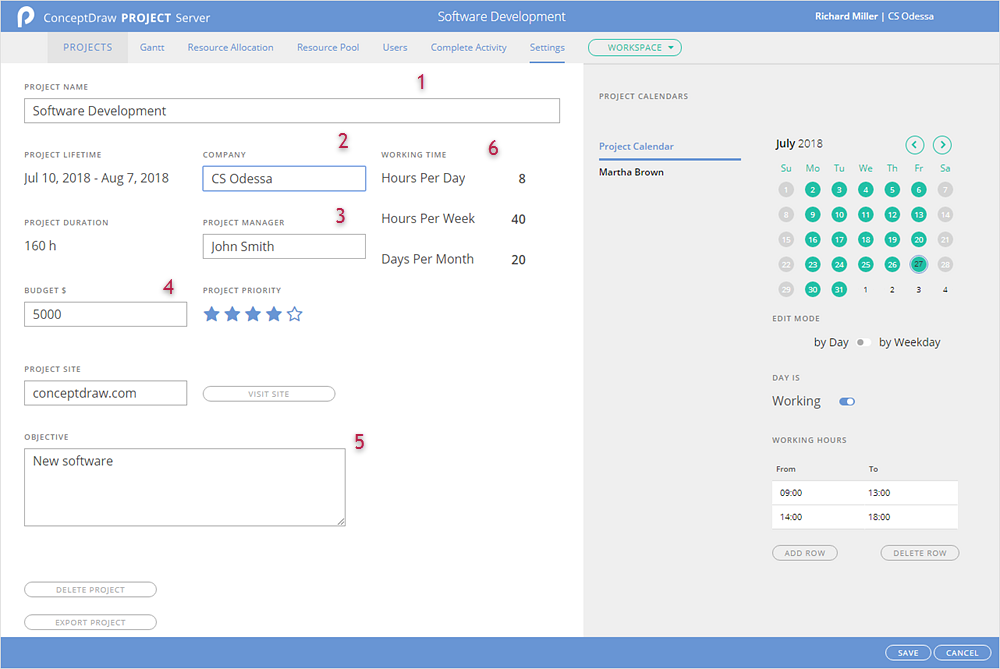
How to Adjust Project Settings

ConceptDraw PROJECT Server cloud storage can store a lot of project files: files uploaded by owner projects that are shared with him and a set of project-examples. A number of projects, you can upload and a number of participants you can invite depends on your tariff plan. You can view setup options of your project on the Project Settings page. Here, you can find out: currency of the project , first day of the week, the number of working hours per day and week, the amount of working days in a month, working hours by default, company name, start and finish date of the project, name of the project manager, and project objectives.
HelpDesk

What Information can be Displayed in the Multiproject Dashboard View

The columns in a Multiproject Dashboard tab of ConceptDraw PROJECT determine what information you want to capture on each project. It’s important to make sure you have the correct columns available. This article describes information that multiple projects list can contain.

Process Flowchart

The main reason of using Process Flowchart or PFD is to show relations between major parts of the system. Process Flowcharts are used in process engineering and chemical industry where there is a requirement of depicting relationships between major components only and not include minor parts. Process Flowcharts for single unit or multiple units differ in their structure and implementation. ConceptDraw DIAGRAM is Professional business process mapping software for making Process flowcharts, Process flow diagram, Workflow diagram, flowcharts and technical illustrations for business documents and also comprehensive visio for mac application. Easier define and document basic work and data flows, financial, production and quality management processes to increase efficiency of your business with ConcepDraw DIAGRAM. Business process mapping software with Flowchart Maker ConceptDraw DIAGRAM includes extensive drawing tools, rich examples and templates, process flowchart symbols and shape libraries, smart connectors that allow you create the flowcharts of complex processes, process flow diagrams, procedures and information exchange. Process Flowchart Solution is project management workflow tools which is part ConceptDraw Project marketing project management software. Drawing charts, diagrams, and network layouts has long been the monopoly of Microsoft Visio, making Mac users to struggle when needing such visio alternative like visio for mac, it requires only to view features, make a minor edit to, or print a diagram or chart. Thankfully to MS Visio alternative like ConceptDraw DIAGRAM software, this is cross-platform charting and business process management tool, now visio alternative for making sort of visio diagram is not a problem anymore however many people still name it business process visio tools.
How To Create a Process Flow Chart (business process modelling techniques)