This site uses cookies. By continuing to browse the ConceptDraw site you are agreeing to our Use of Site Cookies.

Planning a Trip with ConceptDraw PROJECT

Planning a trip is real work; and the better this work is done, the more chances you have to enjoy an interesting itinerary and the trip in general. A good plan is never overloaded. It is always good to stick to the golden mean. Surely, you can create a perfectly accurate and detailed route. However, following it may become a hard task, which will turn your trip from a pleasure into a race to fulfil your own plan.

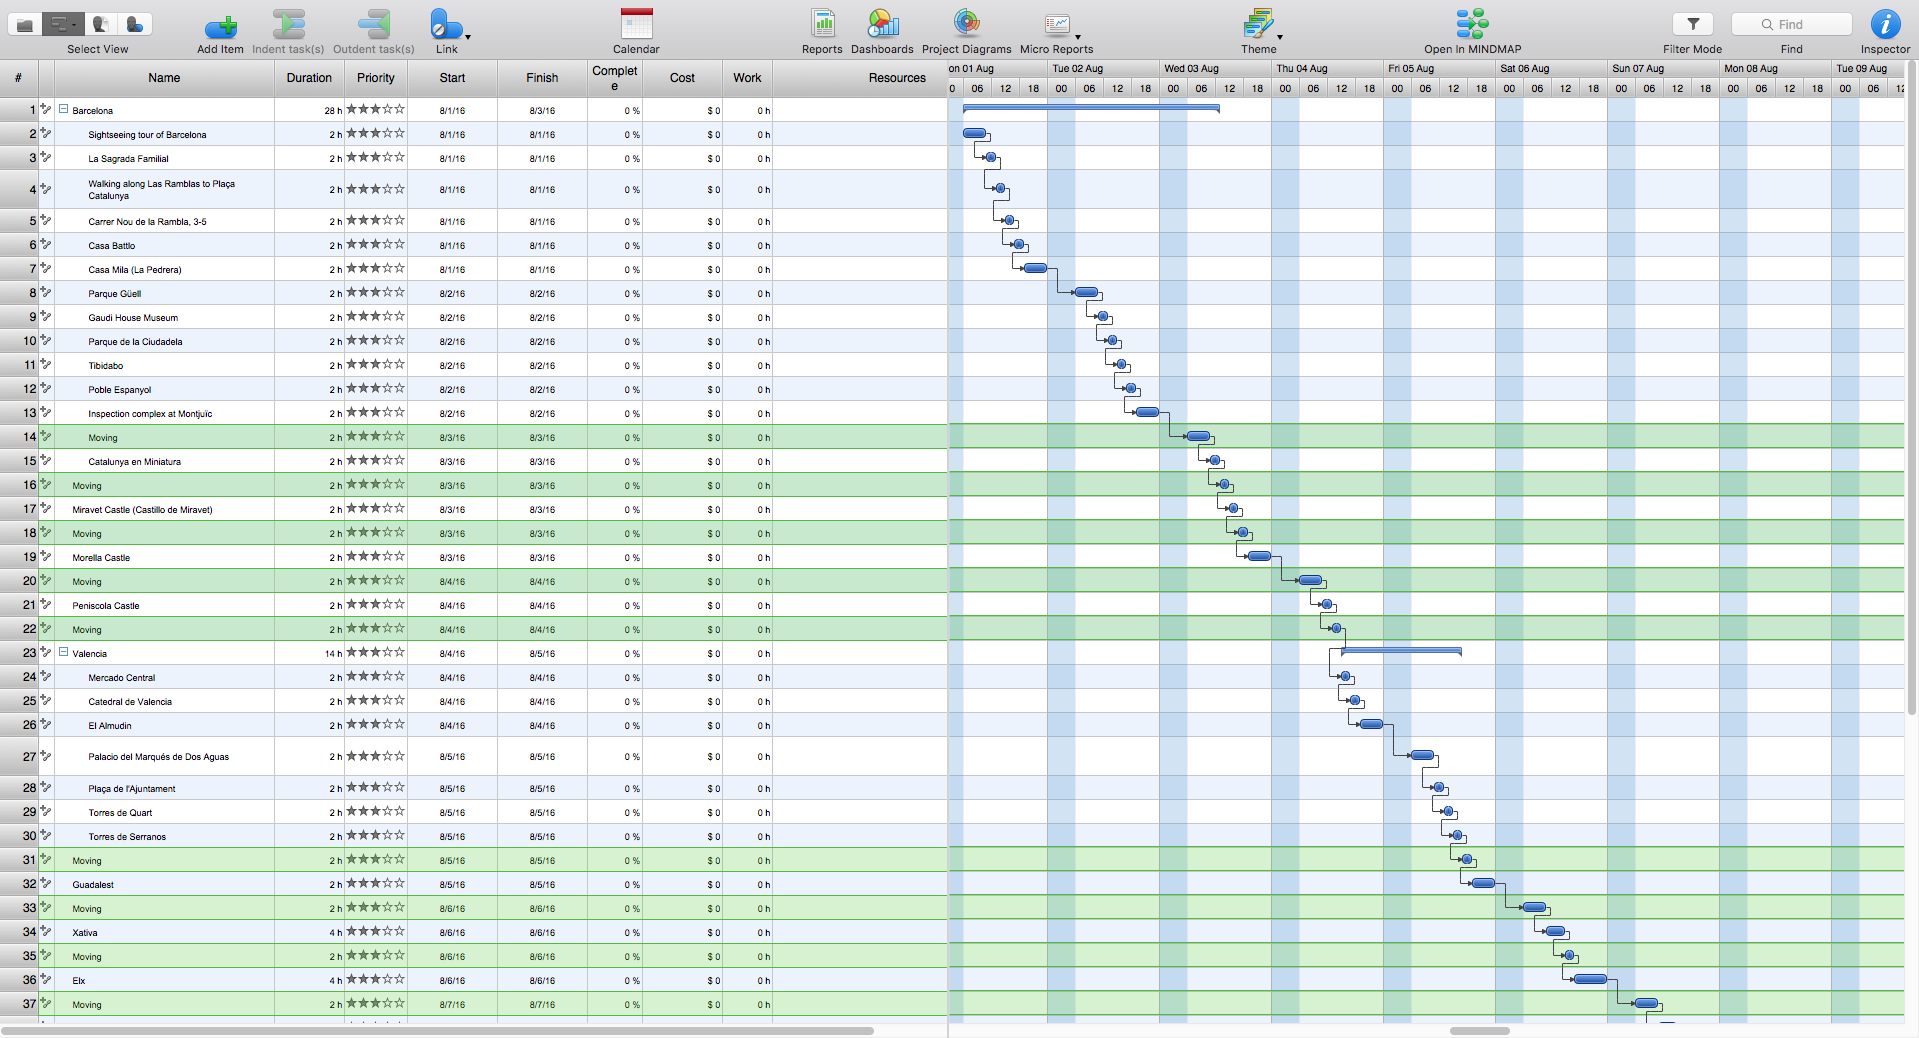
How to Discover Critical Path on a Gantt Chart

ConceptDraw PROJECT is the Gantt chart software that implements critical path method to provide the user with a wide set of project management tools.

How to Create Gantt Chart

To begin managing a new project, you will need to define the individual Tasks that must be completed to deliver it. The default view for a new project in ConceptDraw PROJECT is the Gantt Chart.
HelpDesk

How to Change the Working Time in a Project

Project calendar determines working and non-working time of the project. It is used as a base to the project schedule development. There two types of project calendars: Project Calendar - which sets the working time for the whole project; and the Resource Calendar- which sets the working time of the particular project resource. The following article describes how to change the default calendar in ConceptDraw PROJECT.

Activity Network (PERT) Chart

Activity Network and Project Evaluation and Review Technique, or PERT, charts are a way of documenting and analyzing the tasks in a project.
This diagram is constructed as part of the process in creating a schedule of corrective actions. The Activity Network Chart (PERT) shows the logical connections and consequence of tasks to be performed. It displays the time period for problem solving and the implementation of all activities through the critical path.
HelpDesk

How to Change the Timescale in a Gantt Chart View

Most views in ConceptDraw PROJECT Server have a timescale that shows the units of project time measurement (hour, day, week, etc.) used to schedule project tasks. You can change the timescale to view smaller or bigger time units, from hours all the way up to years. For example, you may want to show time in quarterы of the yearб or you may want to show a Gantt chart across months and days.
HelpDesk

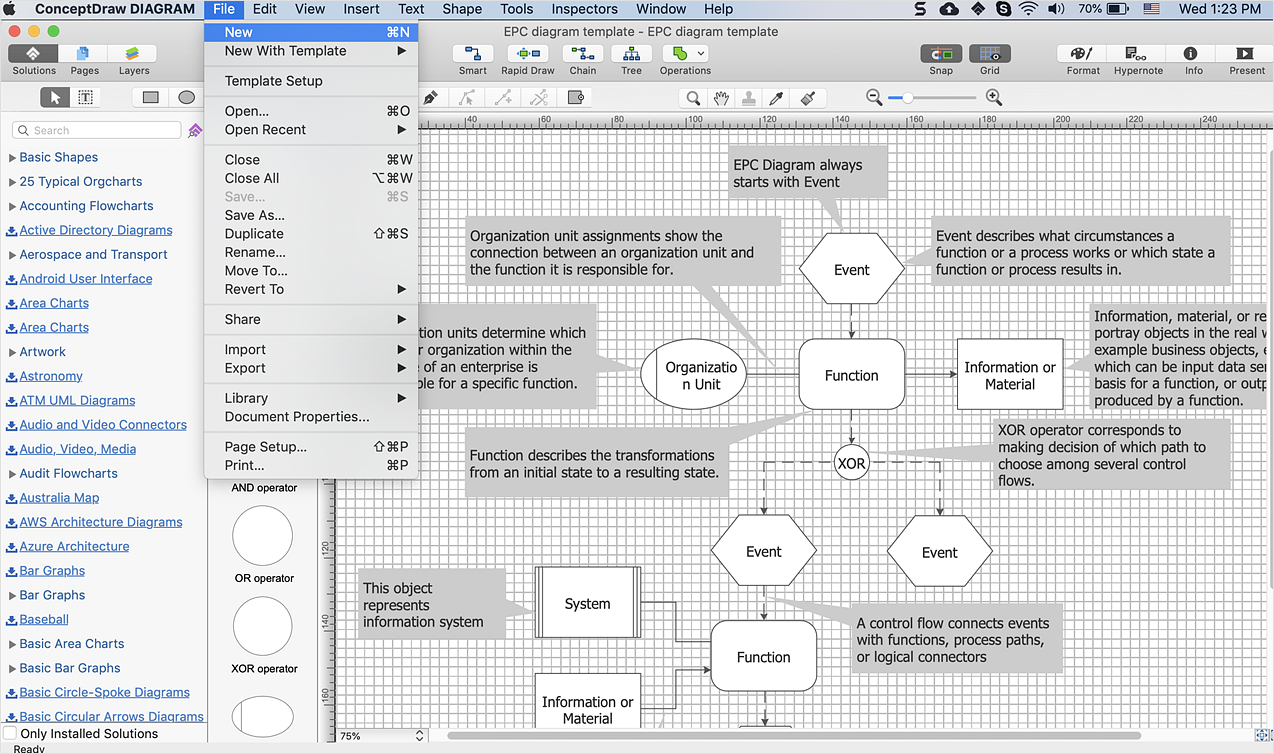
How to Change the Startup Page in ConceptDraw DIAGRAM

You can create a diagram with ConceptDraw DIAGRAM using your custom Template. You can set up your Template as a default ConceptDraw DIAGRAM start page. If you find yourself creating similar documents over and over again, it might be a good idea to save one of them as a template. Then you won't have to format your documents each time you want to make a new one. Just open the template and start from there. There are several tips for the ConceptDraw DIAGRAM startup page. This article describes how to set your desired start page.

Gantt Chart Software

The Gantt Chart is the main interface in ConceptDraw PROJECT. It summarizes the tasks in your project and presents them graphically so you can easily view your progress.

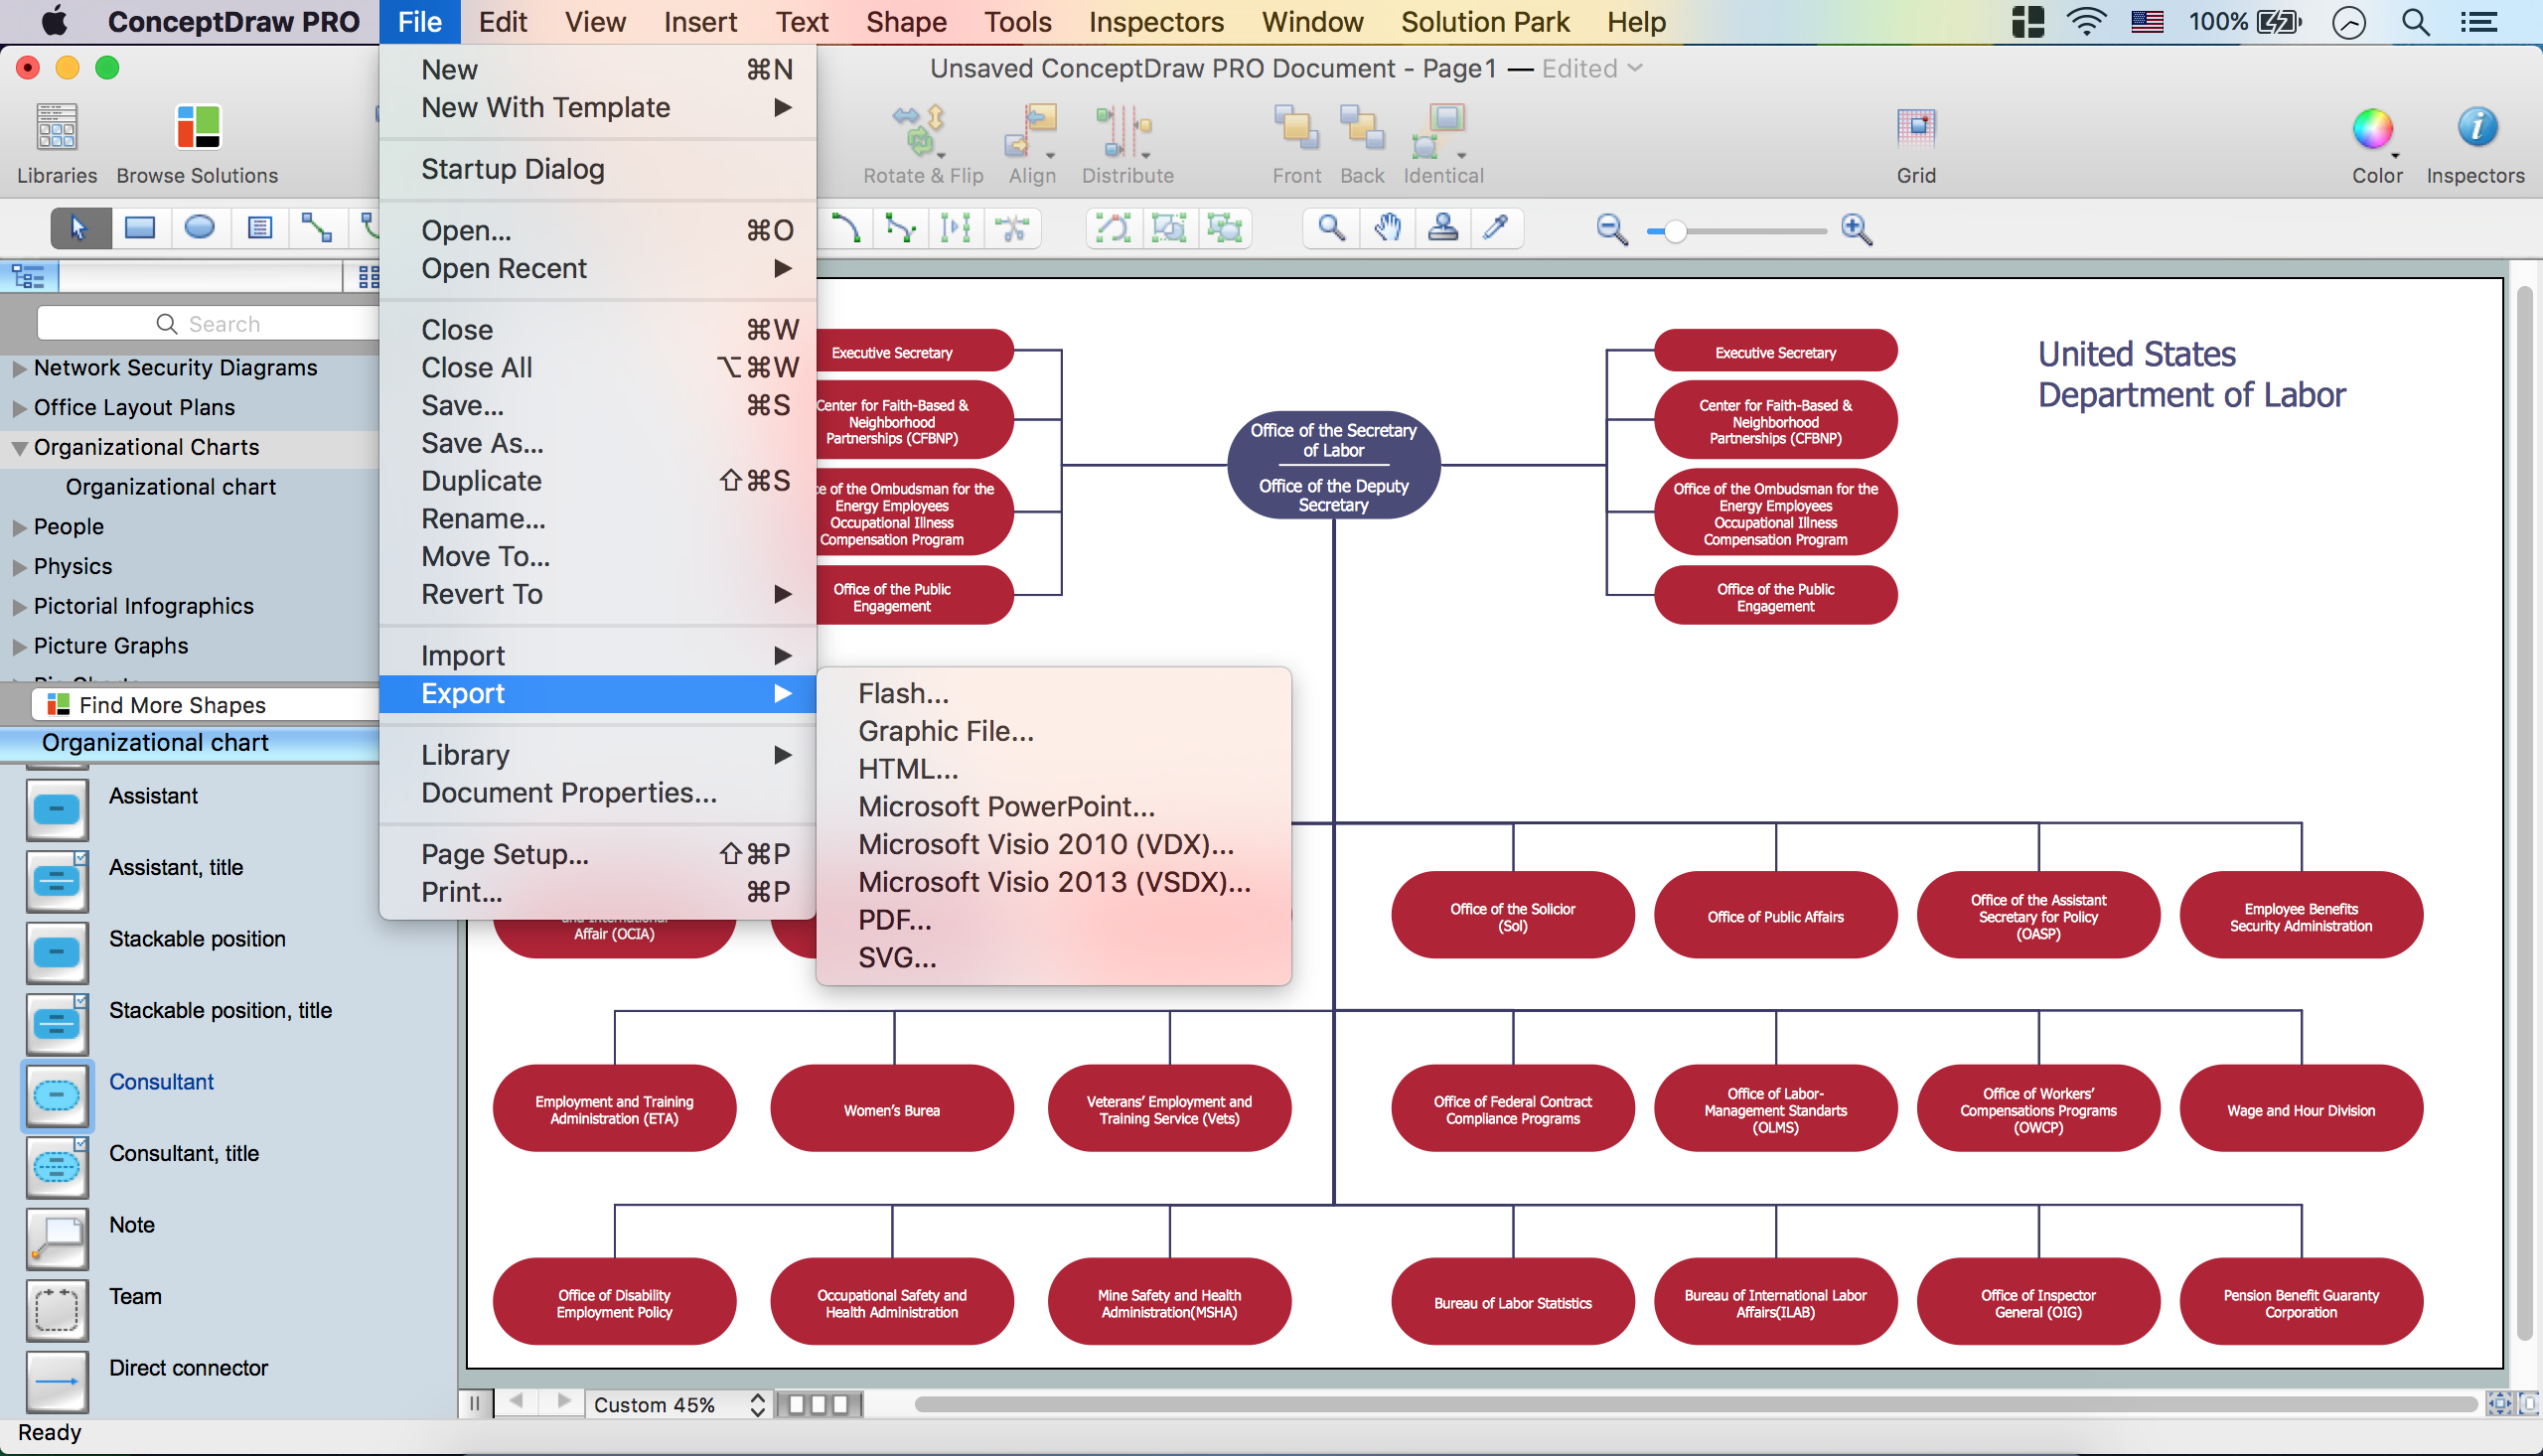
Create Organizational Chart

CSOdessa team is happy to provide cost effective Organizational Chart Software for companies of any size. It is a ConceptDraw DIAGRAM extended with Organizational Charts Solution from the Management Area.
ConceptDraw DIAGRAM organizational chart professional software allows quickly create organizational charts, flow charts, time lines, and much more. Use it for drawing organizational chart for any size company and analyzing organizational structure. Use ConceptDraw to create organizational chart, visualize company Organizational chart, hospital Organizational chart, hotel Organizational chart, corporate organizational chart, etc.