Planning a Trip with ConceptDraw PROJECT
Let’s say that you’re planning a long vacation, touring Europe. Remember that planning a trip is real work. The better the plan, the better your chances are that you will have an interesting itinerary and a fulfilling travel experience. Surely, you can create a perfectly accurate and detailed route, based on your flight times; however, following that plan may become difficult (especially if you’re on a budget). Travelling without a coherent plan can result in running out of time or money, forcing you to compromise your vacation plans. Keeping a detailed plan provides you with the flexibility that can help mitigate the effects of unforeseen circumstances and will allow you meet your vacation goals.
1. Make a list of the places you want to visit during your trip.
1.1. Open ConceptDraw PROJECT, create a new document and save it. The Gantt chart window will open automatically.
1.2. Imagine the rough outline of your itinerary. Define where your trip is going to start and end. Think about the cities and places you will go through.
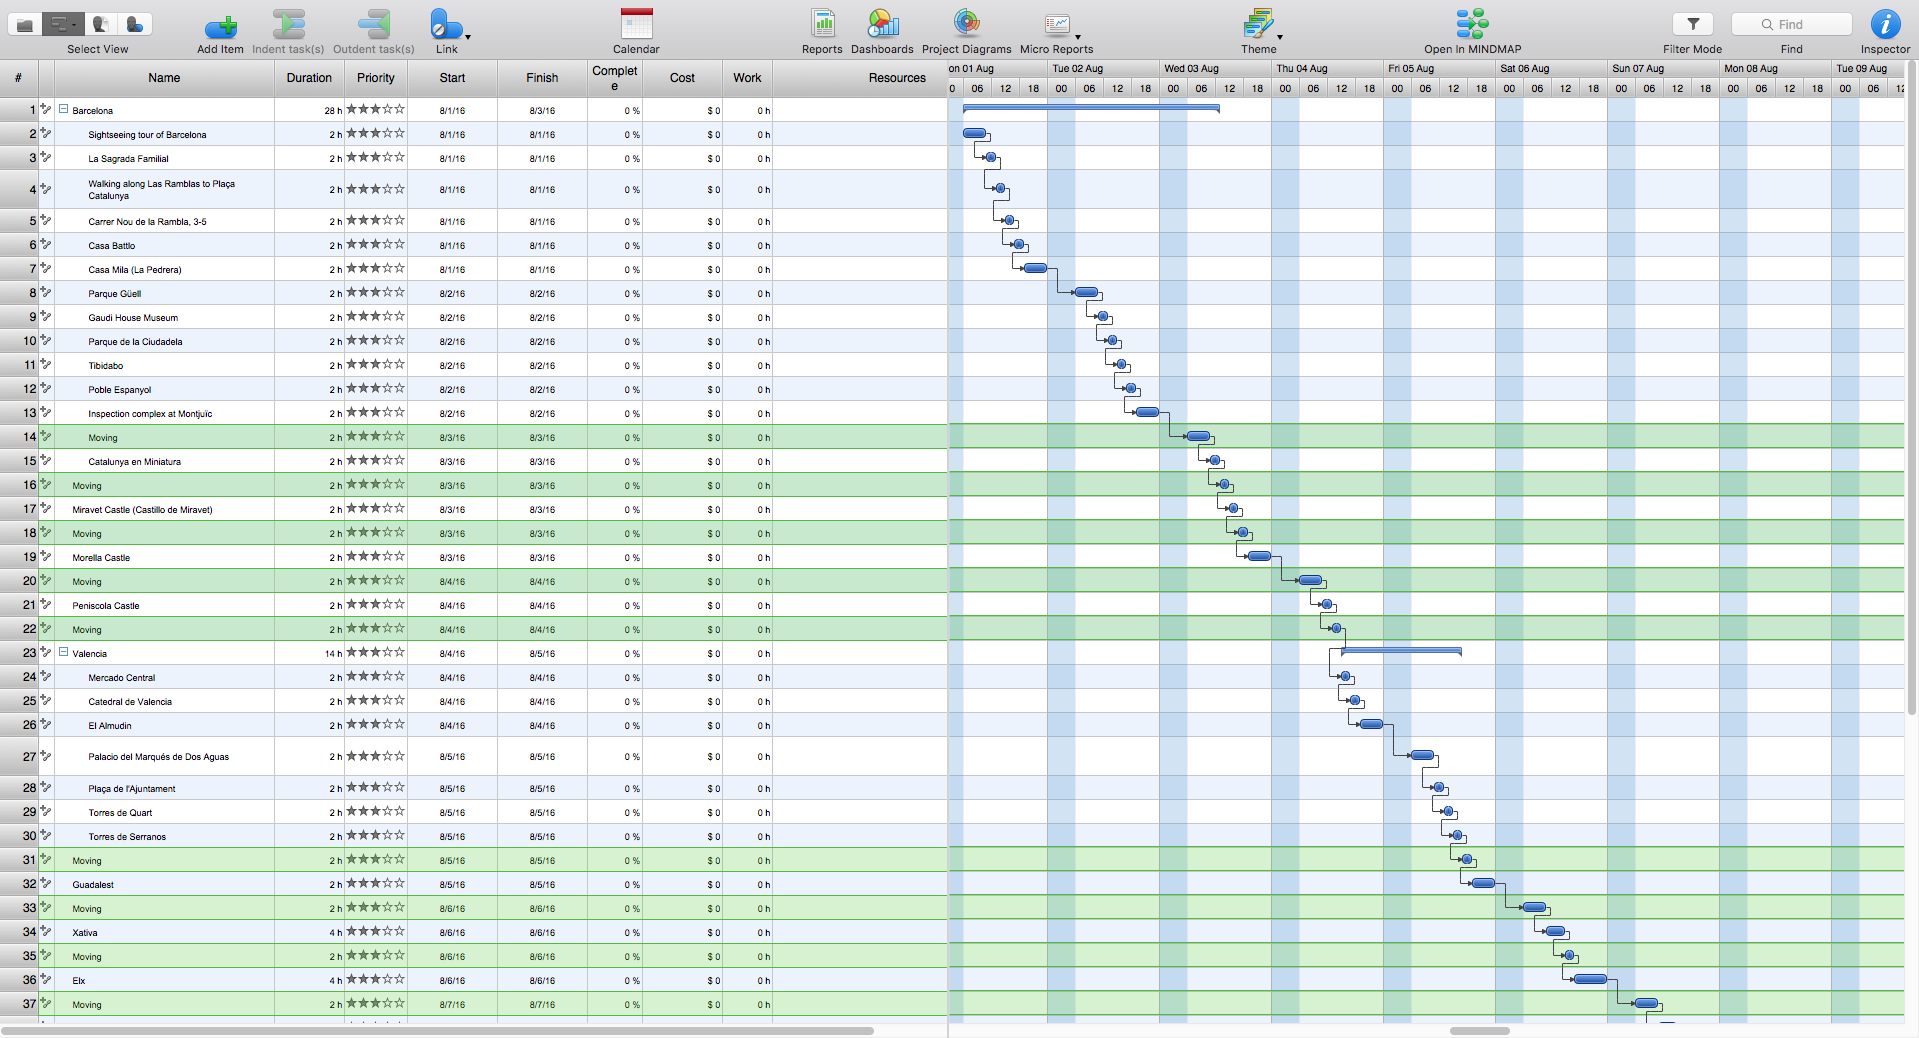
1.3. As the first task, set the first city or destination of your trip. Suppose you are planning a driving trip along the South of Spain, and the first city in your itinerary is Barcelona. To add a new point in the Gantt chart, click Add on the Home toolbar or just click Enter. Indicate the start date of your trip in the first point. The same date will be set by default in the further points.
1.4. Define the cities and destinations you would like to visit. Enter each of them as a task into the table area of the Gantt chart. In the same way you have to indicate the last point of your itinerary (in our example it is going to be Barcelona again).
1.5. In a search engine, find the information about the destinations you are planning to visit. Assess how much time you need to visit each of them.
1.6. If the point of your destination, which is set as a task, requires more time to be examined and consists of several places, you may find it efficient to specify it. For example, Barcelona is a big city with a number of interesting places. You can add some sub items (subtasks) to the main point (task). Such specification is required to assess the time you need to visit a large site more accurately.
1.7. Click on the line ‘Barcelona’ and then click Add subitem on the Home toolbar. Enter the first subtask, for instance, ‘Sightseeing tour of Barcelona’. To enter other sub items, click Add again.
1.8. Let’s enter all possible subtasks for ‘Barcelona’ point: The Basilica Sagrada Familia, walking along Las Ramblas to the Plaça de Catalunya, visiting the famous hill of Montjuïc, etc… Mind that the point ‘Barcelona’ after acquiring the subtasks has turned from a task into a phase. A phase is a group of tasks. Each of them can become a phase as required.
1.9. In the same way, enter all points and sub items that you want to prioritize during your trip.
2. Assess the approximate duration of the trip planned.
2.1. So, now you have all points of your trip listed. Some of them are phases, and some of them are tasks. Now you need to assess the duration of each task in your trip. The duration of the phases will be calculated automatically. Enter the duration of each task in the Duration box in the table area of the Gantt chart or Task panel. It will be more accurate if you indicate time in hours.
2.2. You need time to get to each point of your destination. So, insert extra points where it is necessary – Moving. These points will represent your physical moving between the points. For each Moving point enter the time needed for a journey by filling in the respective Duration box. Take into account that this time can really depend on a type of a vehicle and road. Add some extra time to the journey duration.
2.3. Change the calendar of your project. Set Saturdays and Sundays as working days during your trip. Change Day working time to show the time of your trip. It is better to remove the lunch hour and set one time range for each day of your trip.
2.4. Link all the tasks of your trip to see the logical order of visiting all the points of your trip and the journeys between them. Tip: do not link the phases.
2.5. After linking, all the points of your trip are set one after another with respect to time, and you can assess the whole duration of the trip.
3. Correcting the plan.
3.1. The plan of your trip may need reviewing and further correction. To assess the plan, you need to prepare the Gantt chart a bit. Click Scale on the View toolbar and choose the review scale of the graphic part of the Gantt chart – Day-6 hours. You will be able to see the distribution of the tasks over the days.
3.2. Select with a marker (Markers on the Home toolbar) all ‘Moving’ points. It will be easier to analyze the concentration of your journeys.
3.3. Assess the duration of the whole trip. If you think it is excessive, you may have to remove some points. If you remove the points, you will also lose the links. Restore the missing links.
3.4. Analyze a number and duration of your journeys per day. If you have too many of them, make some changes. For example, shift the journey to a time that is more convenient.
Create a memo. Click on Reports on the Reports toolbar and choose Send Tasks List. A new menu will open – set Report Period into Document Timeline. The report is created as an Excel file and can be saved or printed out.
Have a nice trip!


